29
/
en
AIzaSyAYiBZKx7MnpbEhh9jyipgxe19OcubqV5w
April 1, 2024
185955
Madagascar
MDG
true
2
1
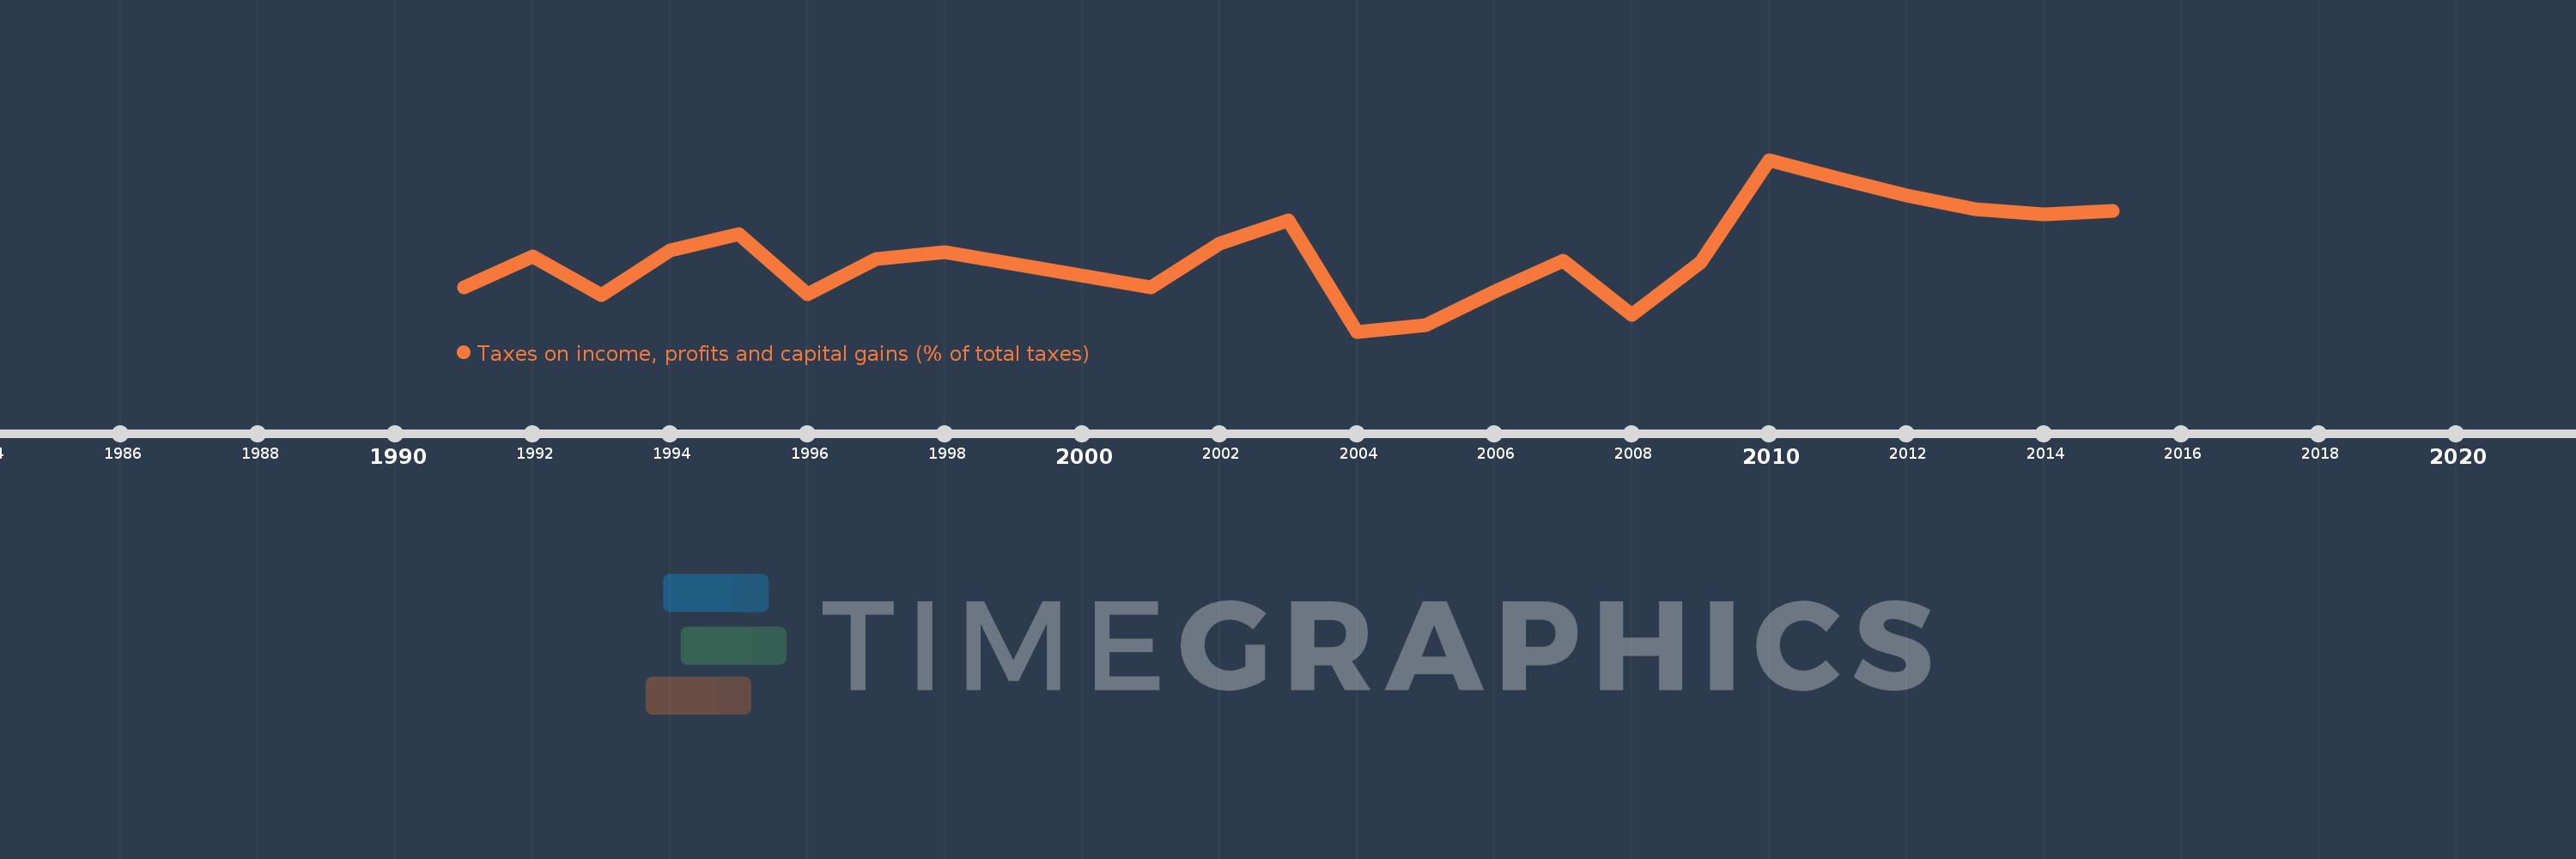
Taxes on income, profits and capital gains (% of total taxes)
2015,2014,2013,2012,2011,2010,2009,2008,2007,2006,2005,2004,2003,2002,2001,1998,1997,1996,1995,1994,1993,1992,1991
This statistics in other country:
AfghanistanAlbaniaAlgeriaAngolaAntigua and BarbudaArgentinaArmeniaAustraliaAustriaAzerbaijanBahrainBangladeshBarbadosBelarusBelgiumBelizeBeninBhutanBoliviaBosnia and HerzegovinaBotswanaBrazilBulgariaBurkina FasoBurundiCabo VerdeCambodiaCanadaCentral African RepublicChileChinaColombiaCongo, Dem. Rep.Congo, Rep.Costa RicaCote d'IvoireCroatiaCyprusCzech RepublicDenmarkDominicaDominican RepublicEgypt, Arab Rep.El SalvadorEquatorial GuineaEstoniaEthiopiaFijiFinlandFranceGambia, TheGeorgiaGermanyGhanaGreeceGrenadaGuatemalaHondurasHong Kong SAR, ChinaHungaryIcelandIndiaIndonesiaIran, Islamic Rep.IraqIrelandIsraelItalyJamaicaJapanJordanKazakhstanKenyaKiribatiKorea, Rep.KuwaitKyrgyz RepublicLao PDRLatviaLebanonLesothoLiberiaLithuaniaLuxembourgMacao SAR, ChinaMacedonia, FYRMadagascarMalawiMalaysiaMaldivesMaliMaltaMauritiusMexicoMicronesia, Fed. Sts.MoldovaMongoliaMoroccoMozambiqueMyanmarNamibiaNepalNetherlandsNew ZealandNicaraguaNigeriaNorwayOmanPakistanPanamaPapua New GuineaParaguayPeruPhilippinesPolandPortugalQatarRomaniaRussian FederationRwandaSamoaSan MarinoSao Tome and PrincipeSenegalSerbiaSeychellesSierra LeoneSingaporeSlovak RepublicSloveniaSolomon IslandsSouth AfricaSpainSri LankaSt. Kitts and NevisSt. LuciaSurinameSwazilandSwedenSwitzerlandSyrian Arab RepublicTajikistanTanzaniaThailandTimor-LesteTogoTrinidad and TobagoTunisiaTurkeyUgandaUkraineUnited KingdomUnited StatesUruguayVenezuela, RBVietnamWest Bank and GazaYemen, Rep.ZambiaZimbabwe Timeline:
This timeline shows a graph from 1991 to 2015 of Madagascar. No data until 1990. Number of actual observations by date: 23.
Source name:
World Development Indicators
Source organization:
International Monetary Fund, Government Finance Statistics Yearbook and data files.
Categories, topics:
Public Sector
Last updated:
apr 23, 2017
Indicators value changes by year
Minimum:
10.922
jan 1, 2004
Maximum:
29.482
jan 1, 2010
At the date of observation
Value
Absolute change
Change from previous value
jan 1, 1991
15.661
+15.661
0.0%
jan 1, 1992
19.042
+3.381
21.59%
jan 1, 1993
14.894
-4.148
-21.79%
jan 1, 1994
19.677
+4.783
32.12%
jan 1, 1995
21.461
+1.784
9.07%
jan 1, 1996
14.971
-6.49
-30.24%
jan 1, 1997
18.795
+3.824
25.54%
jan 1, 1998
19.509
+0.714
3.8%
jan 1, 2001
15.729
-3.78
-19.38%
jan 1, 2002
20.455
+4.726
30.04%
jan 1, 2003
22.894
+2.439
11.92%
jan 1, 2004
10.922
-11.972
-52.29%
jan 1, 2005
11.606
+0.684
6.26%
jan 1, 2006
15.256
+3.65
31.45%
jan 1, 2007
18.607
+3.351
21.96%
jan 1, 2008
12.707
-5.901
-31.71%
jan 1, 2009
18.369
+5.662
44.56%
jan 1, 2010
29.482
+11.113
60.5%
jan 1, 2011
27.533
-1.948
-6.61%
jan 1, 2012
25.648
-1.885
-6.85%
jan 1, 2013
24.101
-1.547
-6.03%
jan 1, 2014
23.592
-0.509
-2.11%
jan 1, 2015
23.951
+0.359
1.52%
Ranking of countries by current statistics by years


Comments: