29
/
en
AIzaSyAYiBZKx7MnpbEhh9jyipgxe19OcubqV5w
April 1, 2024
188542
Malaysia
MYS
true
2
1
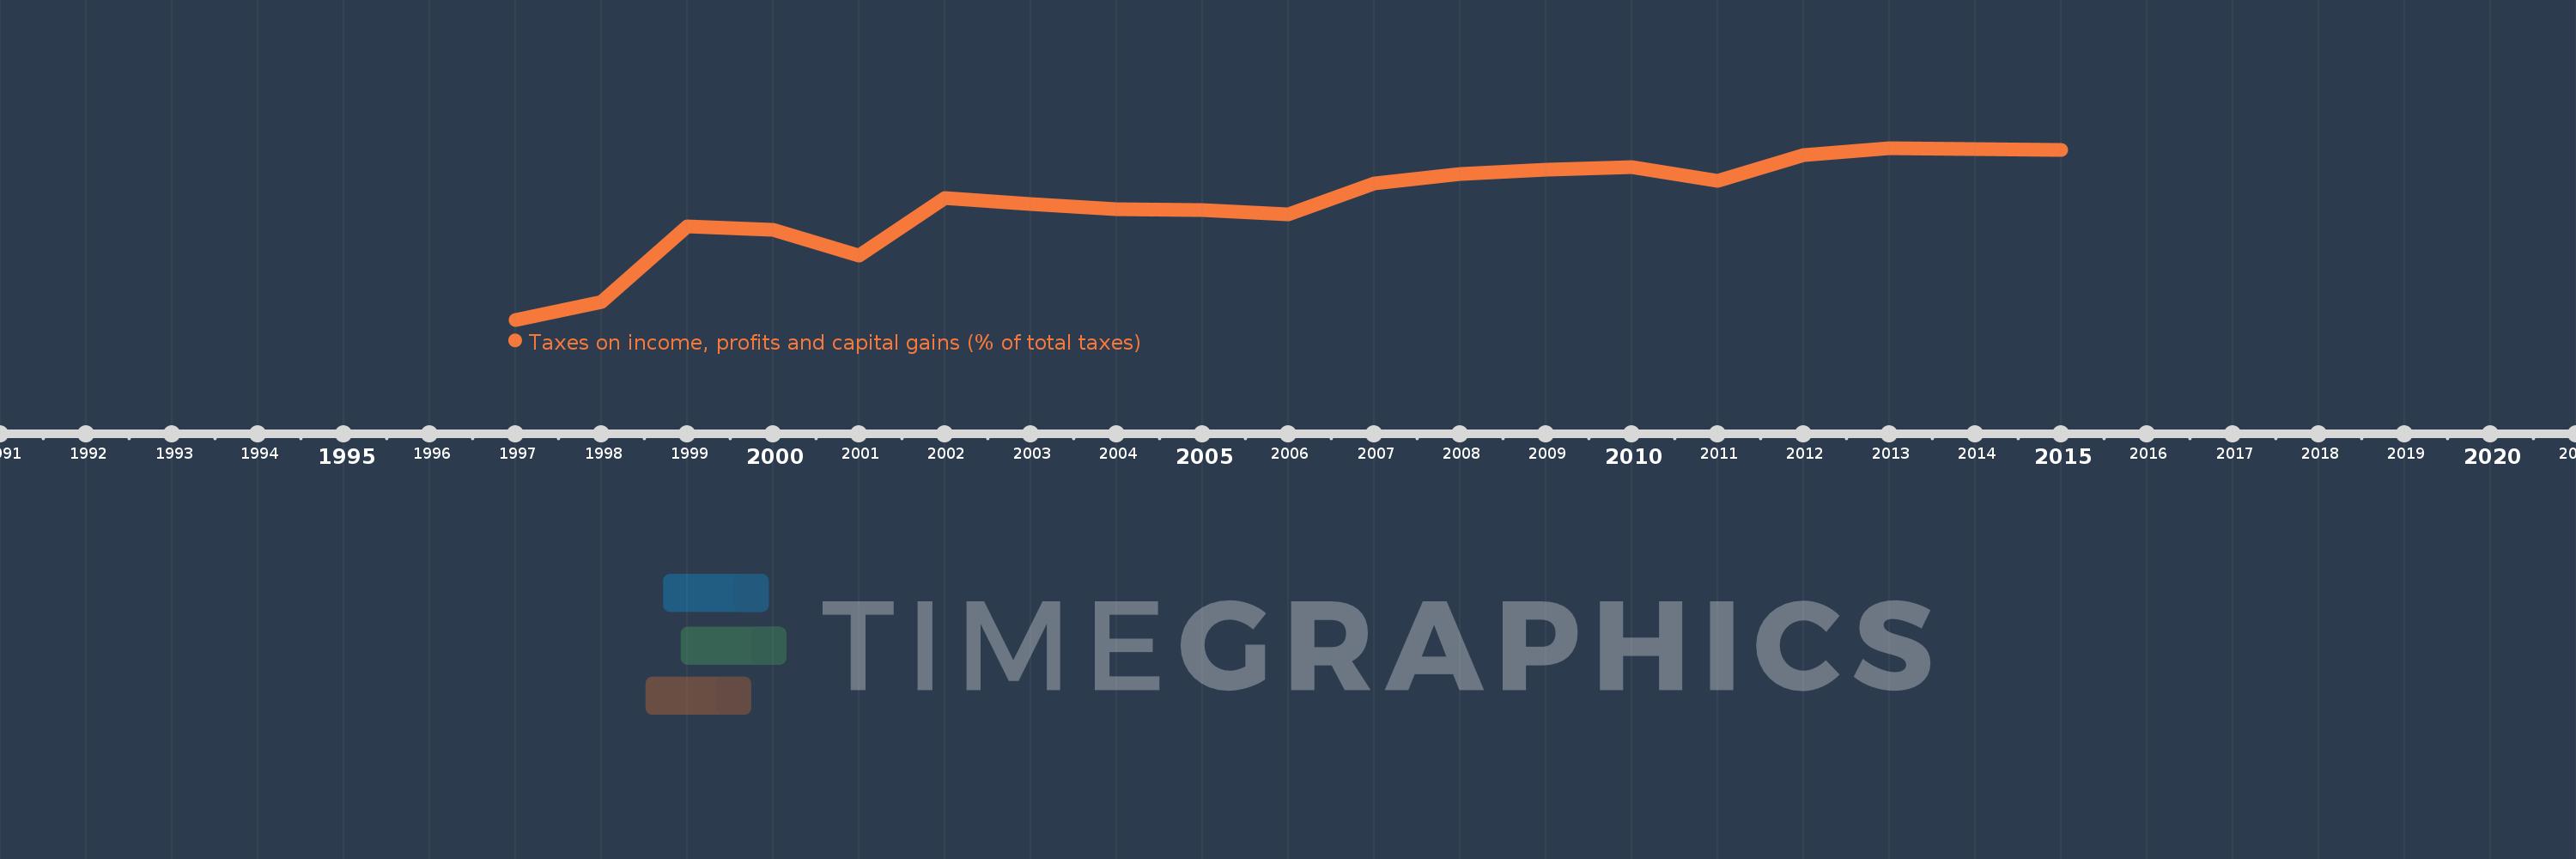
Taxes on income, profits and capital gains (% of total taxes)
2015,2014,2013,2012,2011,2010,2009,2008,2007,2006,2005,2004,2003,2002,2001,2000,1999,1998,1997
This statistics in other country:
AfghanistanAlbaniaAlgeriaAngolaAntigua and BarbudaArgentinaArmeniaAustraliaAustriaAzerbaijanBahrainBangladeshBarbadosBelarusBelgiumBelizeBeninBhutanBoliviaBosnia and HerzegovinaBotswanaBrazilBulgariaBurkina FasoBurundiCabo VerdeCambodiaCanadaCentral African RepublicChileChinaColombiaCongo, Dem. Rep.Congo, Rep.Costa RicaCote d'IvoireCroatiaCyprusCzech RepublicDenmarkDominicaDominican RepublicEgypt, Arab Rep.El SalvadorEquatorial GuineaEstoniaEthiopiaFijiFinlandFranceGambia, TheGeorgiaGermanyGhanaGreeceGrenadaGuatemalaHondurasHong Kong SAR, ChinaHungaryIcelandIndiaIndonesiaIran, Islamic Rep.IraqIrelandIsraelItalyJamaicaJapanJordanKazakhstanKenyaKiribatiKorea, Rep.KuwaitKyrgyz RepublicLao PDRLatviaLebanonLesothoLiberiaLithuaniaLuxembourgMacao SAR, ChinaMacedonia, FYRMadagascarMalawiMalaysiaMaldivesMaliMaltaMauritiusMexicoMicronesia, Fed. Sts.MoldovaMongoliaMoroccoMozambiqueMyanmarNamibiaNepalNetherlandsNew ZealandNicaraguaNigeriaNorwayOmanPakistanPanamaPapua New GuineaParaguayPeruPhilippinesPolandPortugalQatarRomaniaRussian FederationRwandaSamoaSan MarinoSao Tome and PrincipeSenegalSerbiaSeychellesSierra LeoneSingaporeSlovak RepublicSloveniaSolomon IslandsSouth AfricaSpainSri LankaSt. Kitts and NevisSt. LuciaSurinameSwazilandSwedenSwitzerlandSyrian Arab RepublicTajikistanTanzaniaThailandTimor-LesteTogoTrinidad and TobagoTunisiaTurkeyUgandaUkraineUnited KingdomUnited StatesUruguayVenezuela, RBVietnamWest Bank and GazaYemen, Rep.ZambiaZimbabwe Timeline:
This timeline shows a graph from 1997 to 2015 of Malaysia. No data until 1996. Number of actual observations by date: 19.
Source name:
World Development Indicators
Source organization:
International Monetary Fund, Government Finance Statistics Yearbook and data files.
Categories, topics:
Public Sector
Last updated:
apr 23, 2017
Indicators value changes by year
Minimum:
46.089
jan 1, 1997
Maximum:
71.351
jan 1, 2013
At the date of observation
Value
Absolute change
Change from previous value
jan 1, 1997
46.089
+46.089
0.0%
jan 1, 1998
48.723
+2.634
5.71%
jan 1, 1999
59.867
+11.144
22.87%
jan 1, 2000
59.353
-0.514
-0.86%
jan 1, 2001
55.464
-3.889
-6.55%
jan 1, 2002
63.968
+8.504
15.33%
jan 1, 2003
63.069
-0.899
-1.41%
jan 1, 2004
62.32
-0.749
-1.19%
jan 1, 2005
62.239
-0.081
-0.13%
jan 1, 2006
61.539
-0.7
-1.13%
jan 1, 2007
66.197
+4.658
7.57%
jan 1, 2008
67.525
+1.328
2.01%
jan 1, 2009
68.113
+0.588
0.87%
jan 1, 2010
68.561
+0.448
0.66%
jan 1, 2011
66.46
-2.101
-3.06%
jan 1, 2012
70.311
+3.851
5.79%
jan 1, 2013
71.351
+1.04
1.48%
jan 1, 2014
71.165
-0.186
-0.26%
jan 1, 2015
71.02
-0.145
-0.2%
Ranking of countries by current statistics by years


Comments: