29
/
en
AIzaSyAYiBZKx7MnpbEhh9jyipgxe19OcubqV5w
April 1, 2024
129933
Estonia
EST
true
2
1
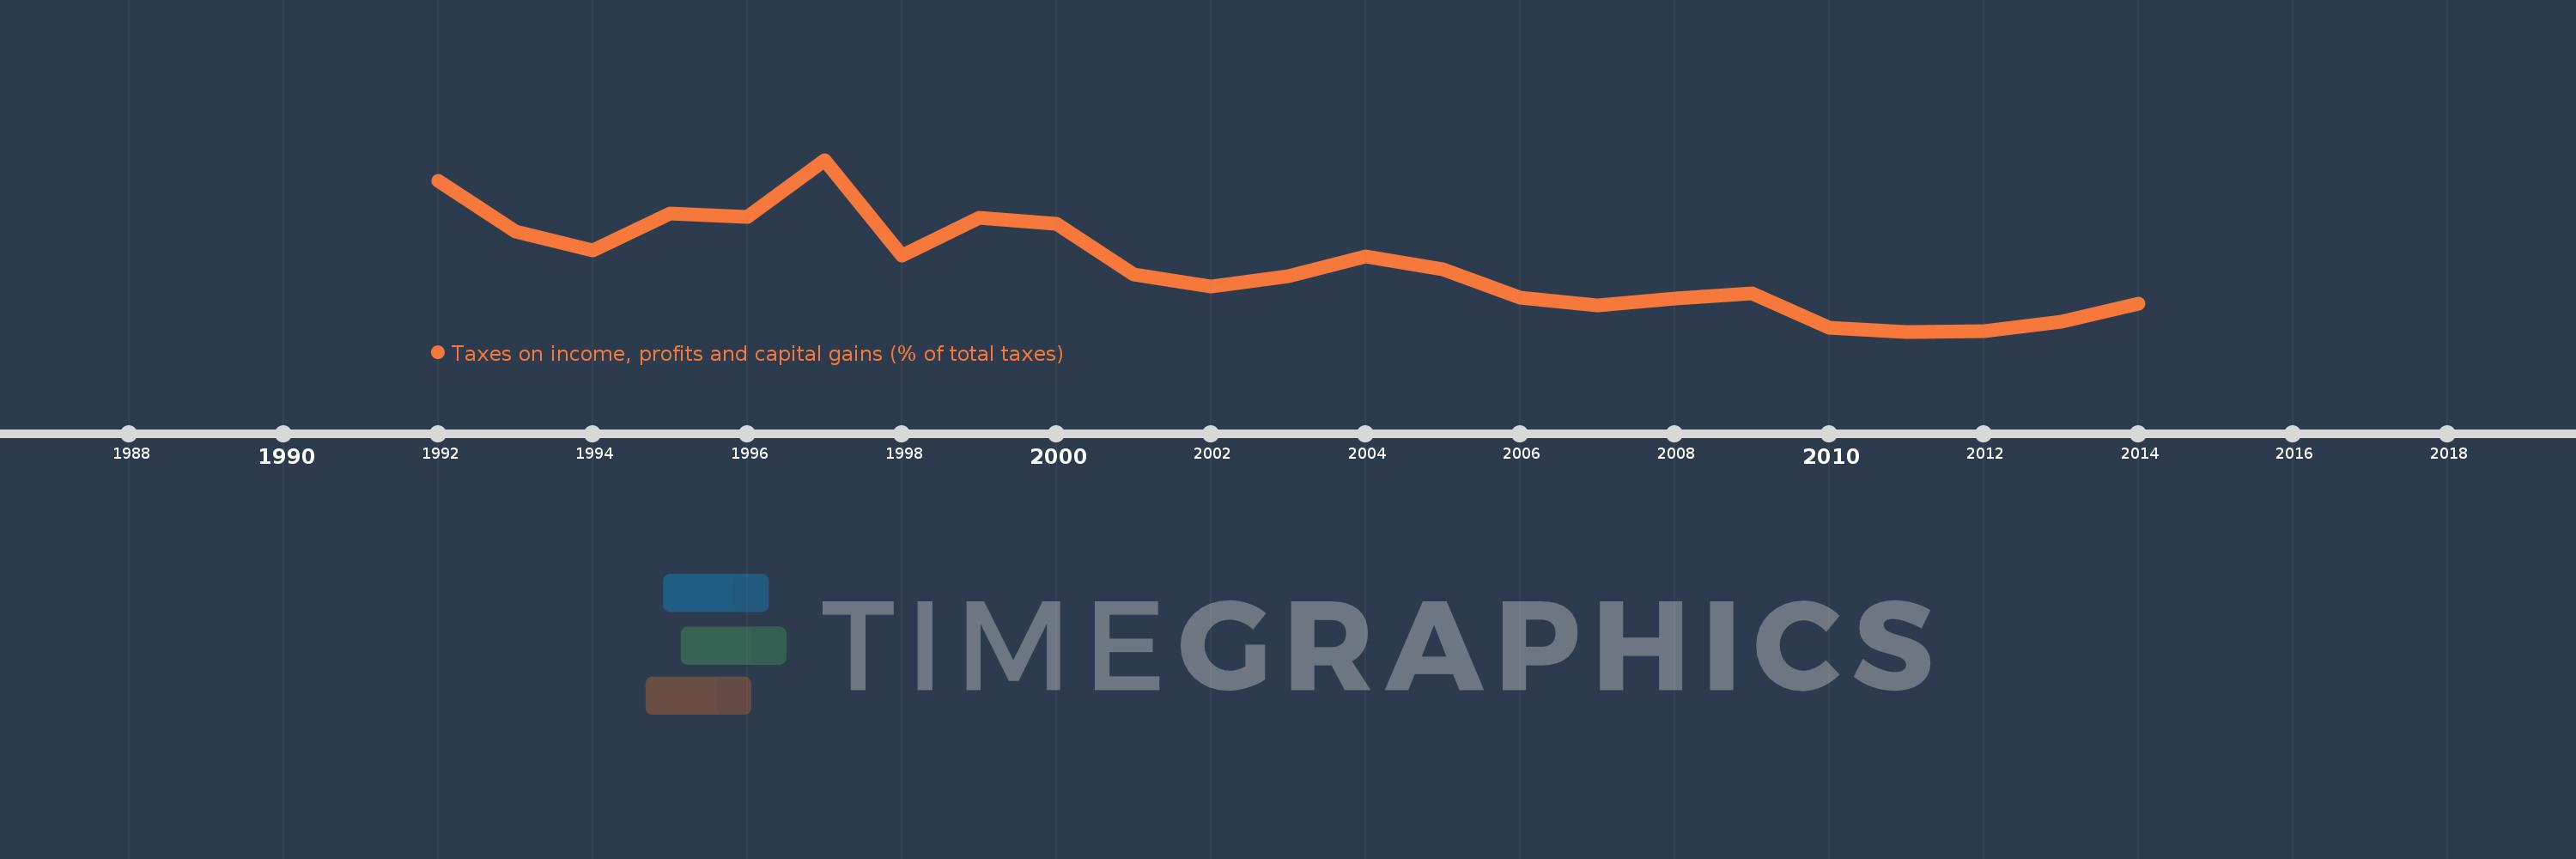
Taxes on income, profits and capital gains (% of total taxes)
2014,2013,2012,2011,2010,2009,2008,2007,2006,2005,2004,2003,2002,2001,2000,1999,1998,1997,1996,1995,1994,1993,1992
This statistics in other country:
AfghanistanAlbaniaAlgeriaAngolaAntigua and BarbudaArgentinaArmeniaAustraliaAustriaAzerbaijanBahrainBangladeshBarbadosBelarusBelgiumBelizeBeninBhutanBoliviaBosnia and HerzegovinaBotswanaBrazilBulgariaBurkina FasoBurundiCabo VerdeCambodiaCanadaCentral African RepublicChileChinaColombiaCongo, Dem. Rep.Congo, Rep.Costa RicaCote d'IvoireCroatiaCyprusCzech RepublicDenmarkDominicaDominican RepublicEgypt, Arab Rep.El SalvadorEquatorial GuineaEstoniaEthiopiaFijiFinlandFranceGambia, TheGeorgiaGermanyGhanaGreeceGrenadaGuatemalaHondurasHong Kong SAR, ChinaHungaryIcelandIndiaIndonesiaIran, Islamic Rep.IraqIrelandIsraelItalyJamaicaJapanJordanKazakhstanKenyaKiribatiKorea, Rep.KuwaitKyrgyz RepublicLao PDRLatviaLebanonLesothoLiberiaLithuaniaLuxembourgMacao SAR, ChinaMacedonia, FYRMadagascarMalawiMalaysiaMaldivesMaliMaltaMauritiusMexicoMicronesia, Fed. Sts.MoldovaMongoliaMoroccoMozambiqueMyanmarNamibiaNepalNetherlandsNew ZealandNicaraguaNigeriaNorwayOmanPakistanPanamaPapua New GuineaParaguayPeruPhilippinesPolandPortugalQatarRomaniaRussian FederationRwandaSamoaSan MarinoSao Tome and PrincipeSenegalSerbiaSeychellesSierra LeoneSingaporeSlovak RepublicSloveniaSolomon IslandsSouth AfricaSpainSri LankaSt. Kitts and NevisSt. LuciaSurinameSwazilandSwedenSwitzerlandSyrian Arab RepublicTajikistanTanzaniaThailandTimor-LesteTogoTrinidad and TobagoTunisiaTurkeyUgandaUkraineUnited KingdomUnited StatesUruguayVenezuela, RBVietnamWest Bank and GazaYemen, Rep.ZambiaZimbabwe Timeline:
This timeline shows a graph from 1992 to 2014 of Estonia. No data until 1991. Number of actual observations by date: 23.
Source name:
World Development Indicators
Source organization:
International Monetary Fund, Government Finance Statistics Yearbook and data files.
Categories, topics:
Public Sector
Last updated:
apr 23, 2017
Indicators value changes by year
Minimum:
16.558
jan 1, 2011
Maximum:
41.583
jan 1, 1997
At the date of observation
Value
Absolute change
Change from previous value
jan 1, 1992
38.526
+38.526
0.0%
jan 1, 1993
31.12
-7.406
-19.22%
jan 1, 1994
28.428
-2.692
-8.65%
jan 1, 1995
33.704
+5.276
18.56%
jan 1, 1996
33.274
-0.43
-1.27%
jan 1, 1997
41.583
+8.308
24.97%
jan 1, 1998
27.637
-13.946
-33.54%
jan 1, 1999
33.076
+5.439
19.68%
jan 1, 2000
32.322
-0.754
-2.28%
jan 1, 2001
24.85
-7.472
-23.12%
jan 1, 2002
23.115
-1.735
-6.98%
jan 1, 2003
24.632
+1.517
6.56%
jan 1, 2004
27.458
+2.826
11.47%
jan 1, 2005
25.675
-1.782
-6.49%
jan 1, 2006
21.44
-4.236
-16.5%
jan 1, 2007
20.349
-1.091
-5.09%
jan 1, 2008
21.341
+0.993
4.88%
jan 1, 2009
22.123
+0.782
3.66%
jan 1, 2010
17.09
-5.033
-22.75%
jan 1, 2011
16.558
-0.532
-3.11%
jan 1, 2012
16.644
+0.086
0.52%
jan 1, 2013
17.95
+1.306
7.84%
jan 1, 2014
20.649
+2.699
15.04%
Ranking of countries by current statistics by years


Comments: