29
/
en
AIzaSyAYiBZKx7MnpbEhh9jyipgxe19OcubqV5w
April 1, 2024
141177
Ghana
GHA
true
2
1
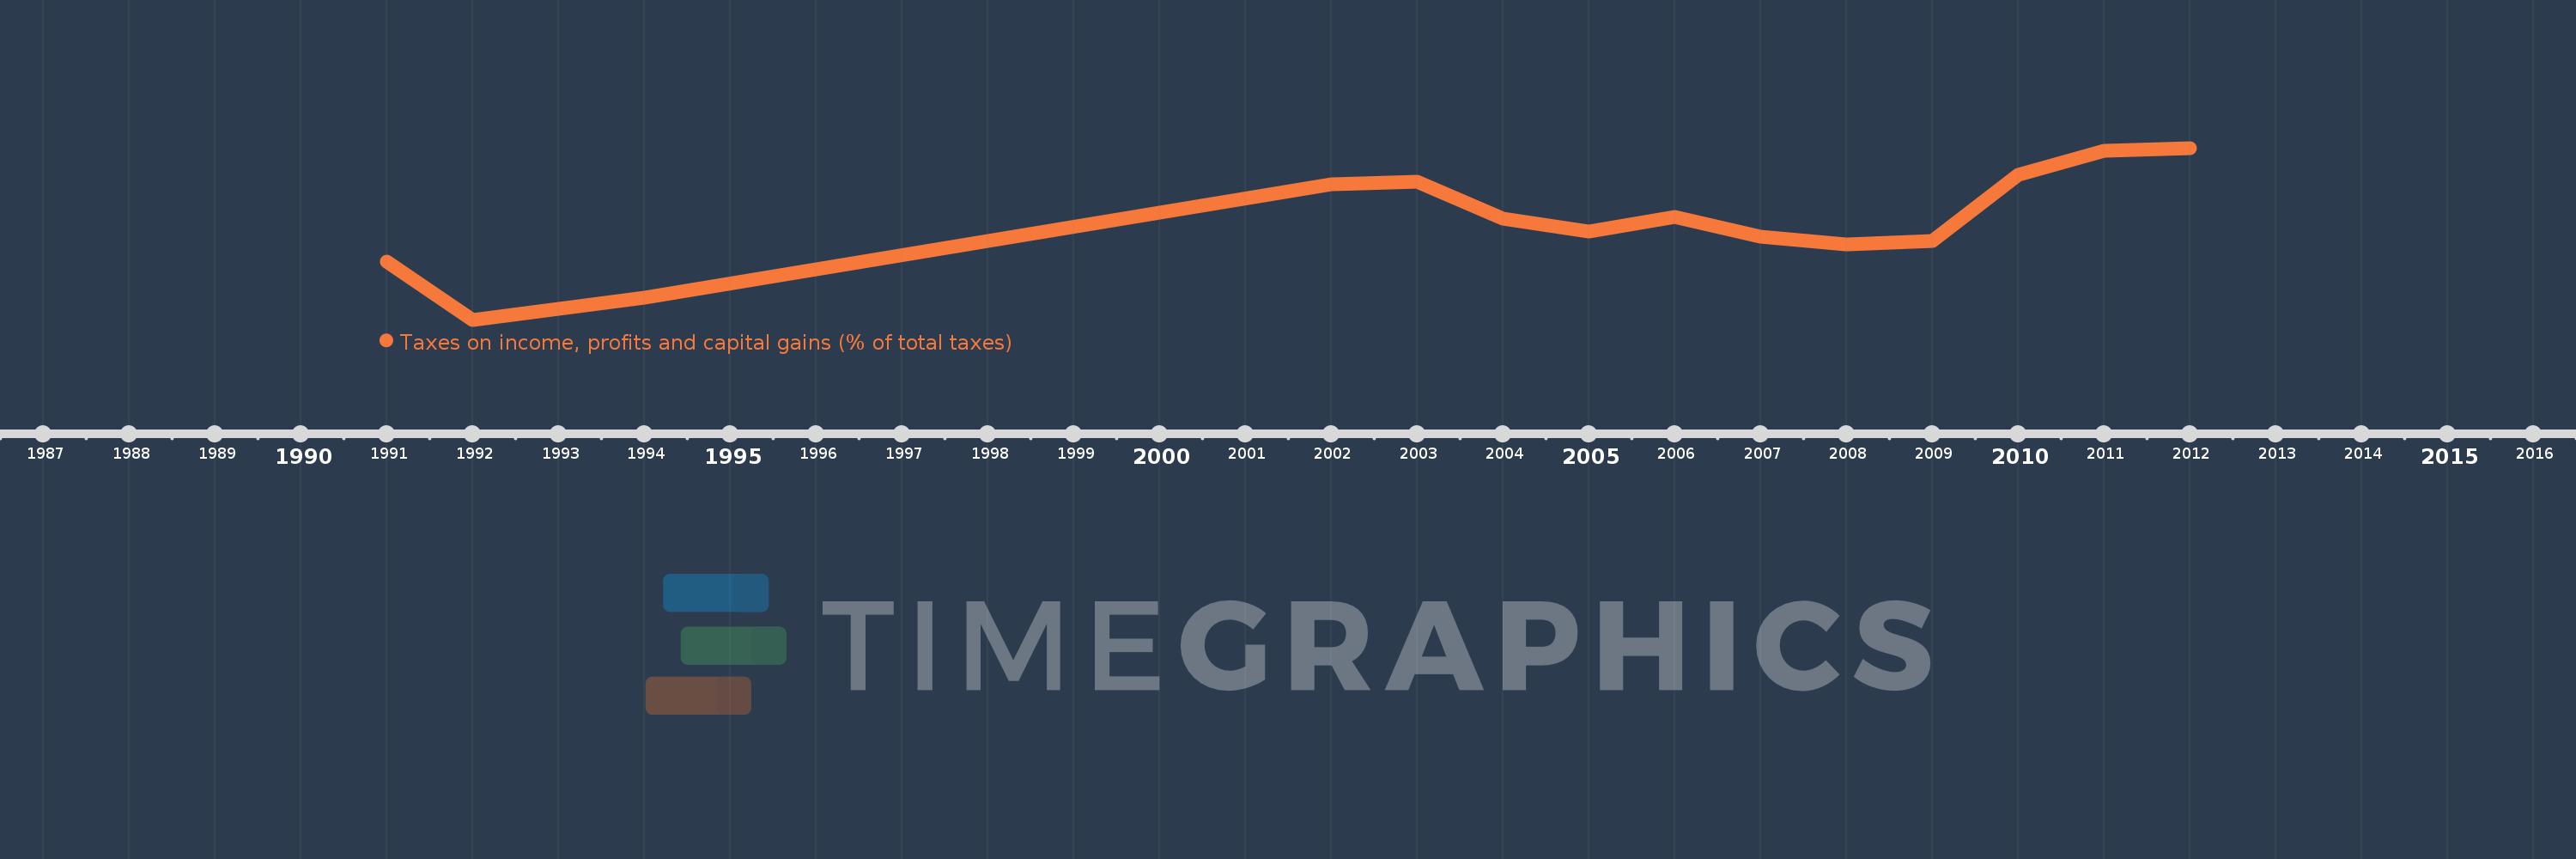
Taxes on income, profits and capital gains (% of total taxes)
2012,2011,2010,2009,2008,2007,2006,2005,2004,2003,2002,1994,1993,1992,1991
This statistics in other country:
AfghanistanAlbaniaAlgeriaAngolaAntigua and BarbudaArgentinaArmeniaAustraliaAustriaAzerbaijanBahrainBangladeshBarbadosBelarusBelgiumBelizeBeninBhutanBoliviaBosnia and HerzegovinaBotswanaBrazilBulgariaBurkina FasoBurundiCabo VerdeCambodiaCanadaCentral African RepublicChileChinaColombiaCongo, Dem. Rep.Congo, Rep.Costa RicaCote d'IvoireCroatiaCyprusCzech RepublicDenmarkDominicaDominican RepublicEgypt, Arab Rep.El SalvadorEquatorial GuineaEstoniaEthiopiaFijiFinlandFranceGambia, TheGeorgiaGermanyGhanaGreeceGrenadaGuatemalaHondurasHong Kong SAR, ChinaHungaryIcelandIndiaIndonesiaIran, Islamic Rep.IraqIrelandIsraelItalyJamaicaJapanJordanKazakhstanKenyaKiribatiKorea, Rep.KuwaitKyrgyz RepublicLao PDRLatviaLebanonLesothoLiberiaLithuaniaLuxembourgMacao SAR, ChinaMacedonia, FYRMadagascarMalawiMalaysiaMaldivesMaliMaltaMauritiusMexicoMicronesia, Fed. Sts.MoldovaMongoliaMoroccoMozambiqueMyanmarNamibiaNepalNetherlandsNew ZealandNicaraguaNigeriaNorwayOmanPakistanPanamaPapua New GuineaParaguayPeruPhilippinesPolandPortugalQatarRomaniaRussian FederationRwandaSamoaSan MarinoSao Tome and PrincipeSenegalSerbiaSeychellesSierra LeoneSingaporeSlovak RepublicSloveniaSolomon IslandsSouth AfricaSpainSri LankaSt. Kitts and NevisSt. LuciaSurinameSwazilandSwedenSwitzerlandSyrian Arab RepublicTajikistanTanzaniaThailandTimor-LesteTogoTrinidad and TobagoTunisiaTurkeyUgandaUkraineUnited KingdomUnited StatesUruguayVenezuela, RBVietnamWest Bank and GazaYemen, Rep.ZambiaZimbabwe Timeline:
This timeline shows a graph from 1991 to 2012 of Ghana. No data until 1990. Number of actual observations by date: 15.
Source name:
World Development Indicators
Source organization:
International Monetary Fund, Government Finance Statistics Yearbook and data files.
Categories, topics:
Public Sector
Last updated:
apr 23, 2017
Indicators value changes by year
Minimum:
19.547
jan 1, 1992
Maximum:
35.905
jan 1, 2012
At the date of observation
Value
Absolute change
Change from previous value
jan 1, 1991
25.102
+25.102
0.0%
jan 1, 1992
19.547
-5.555
-22.13%
jan 1, 1993
20.575
+1.028
5.26%
jan 1, 1994
21.663
+1.089
5.29%
jan 1, 2002
32.446
+10.783
49.77%
jan 1, 2003
32.704
+0.258
0.8%
jan 1, 2004
29.187
-3.517
-10.75%
jan 1, 2005
27.953
-1.234
-4.23%
jan 1, 2006
29.377
+1.424
5.09%
jan 1, 2007
27.475
-1.902
-6.48%
jan 1, 2008
26.684
-0.791
-2.88%
jan 1, 2009
27.059
+0.376
1.41%
jan 1, 2010
33.327
+6.267
23.16%
jan 1, 2011
35.608
+2.281
6.85%
jan 1, 2012
35.905
+0.297
0.84%
Ranking of countries by current statistics by years


Comments: