29
/
en
AIzaSyAYiBZKx7MnpbEhh9jyipgxe19OcubqV5w
April 1, 2024
225452
Poland
POL
true
2
1
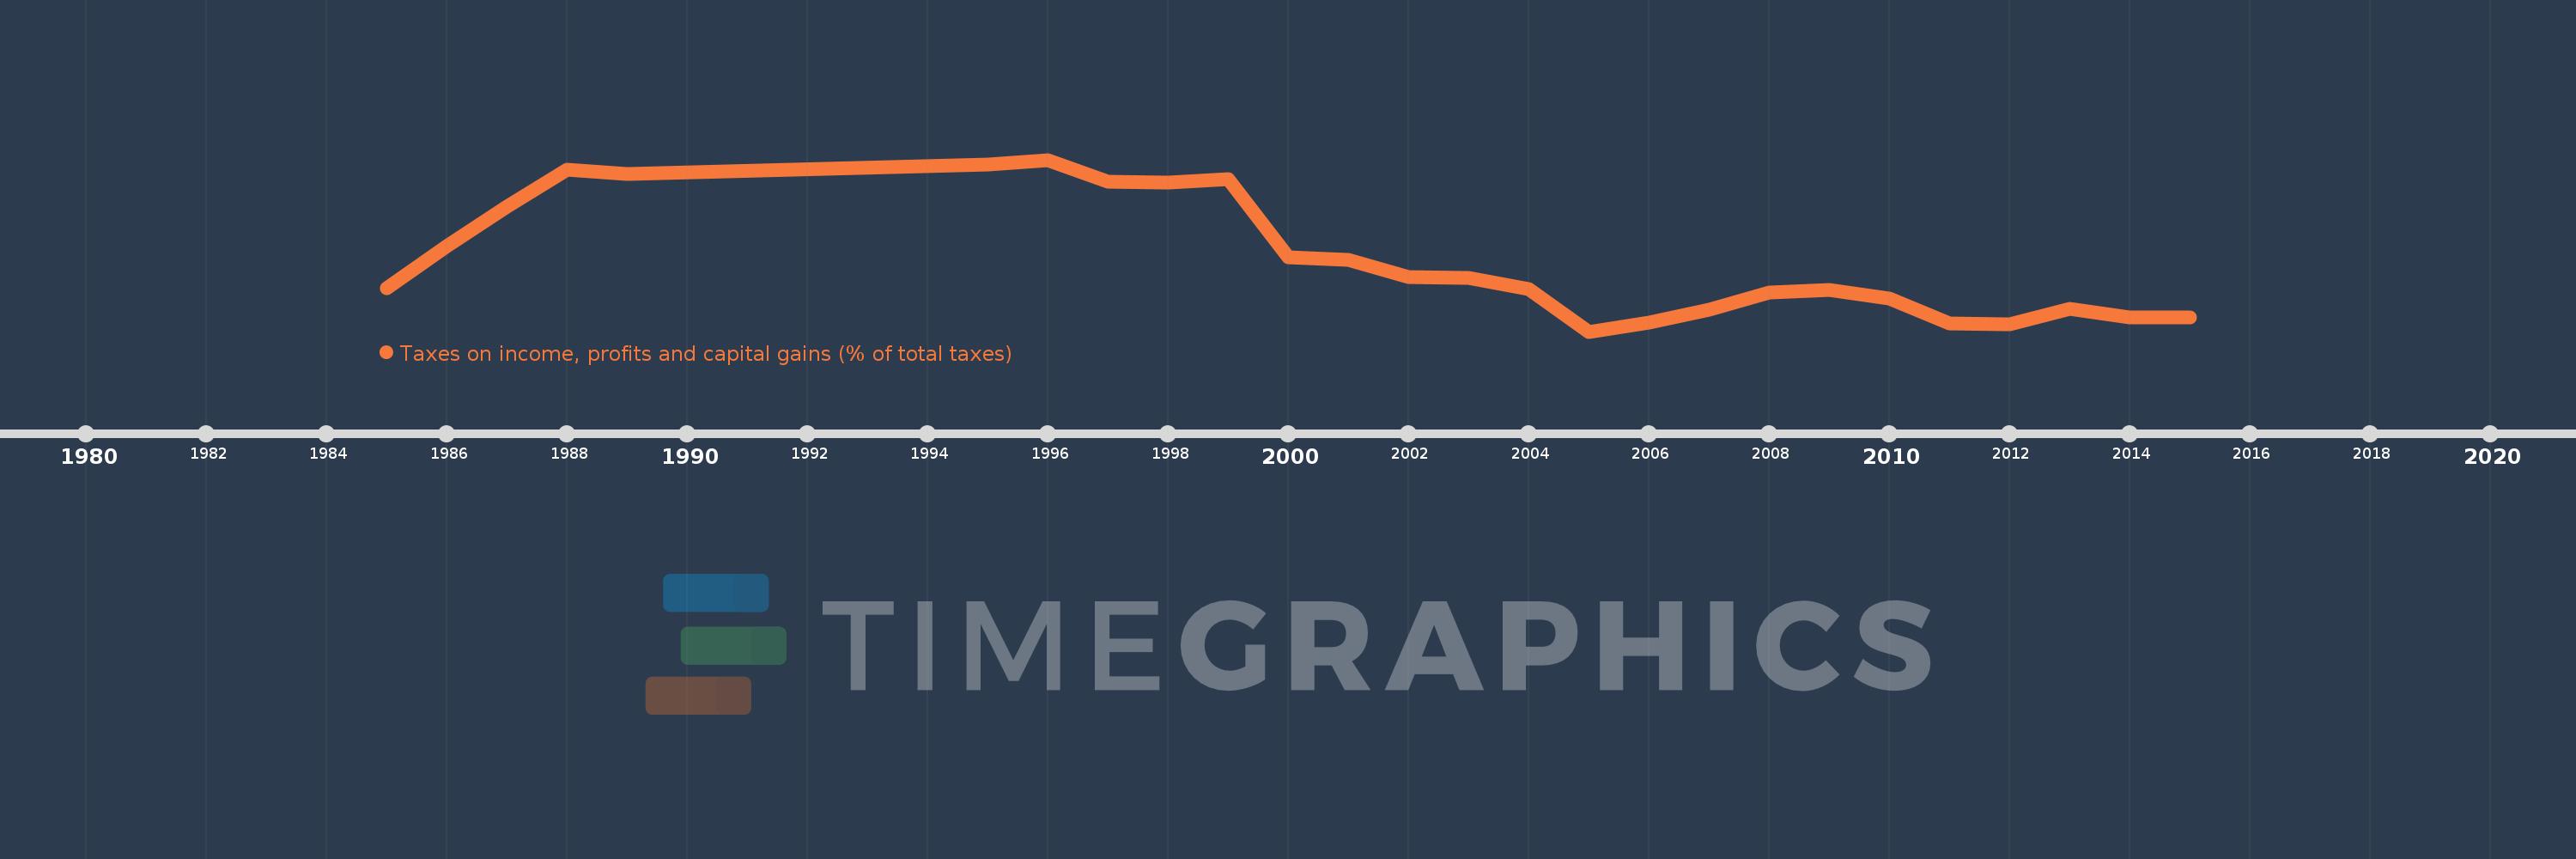
Taxes on income, profits and capital gains (% of total taxes)
2015,2014,2013,2012,2011,2010,2009,2008,2007,2006,2005,2004,2003,2002,2001,2000,1999,1998,1997,1996,1995,1989,1988,1987,1986,1985
This statistics in other country:
AfghanistanAlbaniaAlgeriaAngolaAntigua and BarbudaArgentinaArmeniaAustraliaAustriaAzerbaijanBahrainBangladeshBarbadosBelarusBelgiumBelizeBeninBhutanBoliviaBosnia and HerzegovinaBotswanaBrazilBulgariaBurkina FasoBurundiCabo VerdeCambodiaCanadaCentral African RepublicChileChinaColombiaCongo, Dem. Rep.Congo, Rep.Costa RicaCote d'IvoireCroatiaCyprusCzech RepublicDenmarkDominicaDominican RepublicEgypt, Arab Rep.El SalvadorEquatorial GuineaEstoniaEthiopiaFijiFinlandFranceGambia, TheGeorgiaGermanyGhanaGreeceGrenadaGuatemalaHondurasHong Kong SAR, ChinaHungaryIcelandIndiaIndonesiaIran, Islamic Rep.IraqIrelandIsraelItalyJamaicaJapanJordanKazakhstanKenyaKiribatiKorea, Rep.KuwaitKyrgyz RepublicLao PDRLatviaLebanonLesothoLiberiaLithuaniaLuxembourgMacao SAR, ChinaMacedonia, FYRMadagascarMalawiMalaysiaMaldivesMaliMaltaMauritiusMexicoMicronesia, Fed. Sts.MoldovaMongoliaMoroccoMozambiqueMyanmarNamibiaNepalNetherlandsNew ZealandNicaraguaNigeriaNorwayOmanPakistanPanamaPapua New GuineaParaguayPeruPhilippinesPolandPortugalQatarRomaniaRussian FederationRwandaSamoaSan MarinoSao Tome and PrincipeSenegalSerbiaSeychellesSierra LeoneSingaporeSlovak RepublicSloveniaSolomon IslandsSouth AfricaSpainSri LankaSt. Kitts and NevisSt. LuciaSurinameSwazilandSwedenSwitzerlandSyrian Arab RepublicTajikistanTanzaniaThailandTimor-LesteTogoTrinidad and TobagoTunisiaTurkeyUgandaUkraineUnited KingdomUnited StatesUruguayVenezuela, RBVietnamWest Bank and GazaYemen, Rep.ZambiaZimbabwe Timeline:
This timeline shows a graph from 1985 to 2015 of Poland. No data until 1984. Number of actual observations by date: 26.
Source name:
World Development Indicators
Source organization:
International Monetary Fund, Government Finance Statistics Yearbook and data files.
Categories, topics:
Public Sector
Last updated:
apr 23, 2017
Indicators value changes by year
Minimum:
23.582
jan 1, 2005
Maximum:
42.816
jan 1, 1996
At the date of observation
Value
Absolute change
Change from previous value
jan 1, 1985
28.458
+28.458
0.0%
jan 1, 1986
33.152
+4.694
16.49%
jan 1, 1987
37.536
+4.384
13.22%
jan 1, 1988
41.706
+4.17
11.11%
jan 1, 1989
41.199
-0.507
-1.22%
jan 1, 1995
42.258
+1.058
2.57%
jan 1, 1996
42.816
+0.558
1.32%
jan 1, 1997
40.316
-2.5
-5.84%
jan 1, 1998
40.299
-0.018
-0.04%
jan 1, 1999
40.637
+0.339
0.84%
jan 1, 2000
31.924
-8.714
-21.44%
jan 1, 2001
31.633
-0.29
-0.91%
jan 1, 2002
29.734
-1.899
-6.0%
jan 1, 2003
29.586
-0.148
-0.5%
jan 1, 2004
28.321
-1.265
-4.28%
jan 1, 2005
23.582
-4.74
-16.74%
jan 1, 2006
24.6
+1.018
4.32%
jan 1, 2007
25.988
+1.388
5.64%
jan 1, 2008
27.979
+1.991
7.66%
jan 1, 2009
28.288
+0.31
1.11%
jan 1, 2010
27.246
-1.043
-3.69%
jan 1, 2011
24.518
-2.728
-10.01%
jan 1, 2012
24.362
-0.155
-0.63%
jan 1, 2013
26.138
+1.776
7.29%
jan 1, 2014
25.14
-0.998
-3.82%
jan 1, 2015
25.138
-0.002
-0.01%
Ranking of countries by current statistics by years


Comments: