Download This statistics in other country:
Timeline:
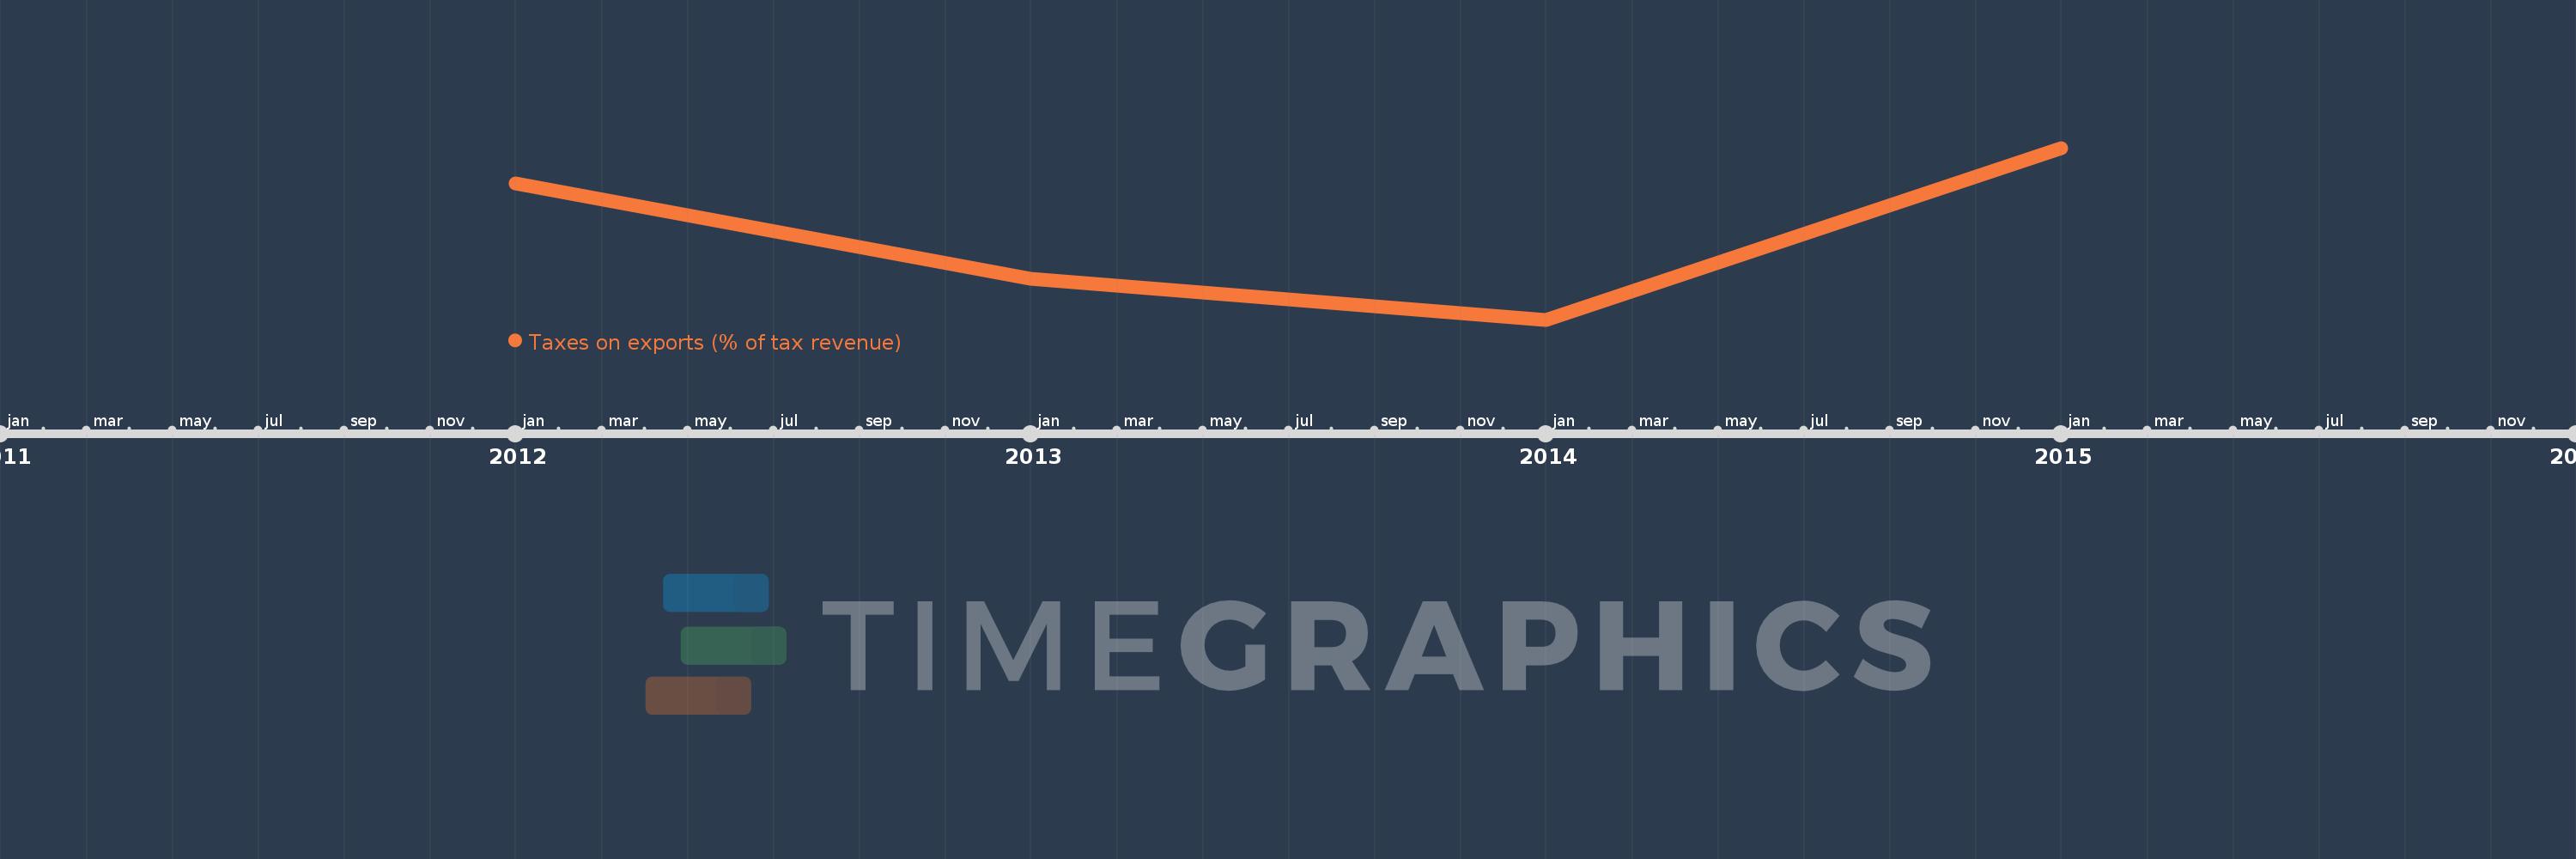
This timeline shows a graph from 2012 to 2015 of Tanzania. No data until 2011. Number of actual observations by date: 4.
Source name:
World Development Indicators
Source organization:
International Monetary Fund, Government Finance Statistics Yearbook and data files.
Categories, topics:
Public Sector, Trade
Last updated:
apr 23, 2017
Indicators value changes by year
At the date of observation
Value
Absolute change
Change from the previous value
jan 1, 2012
0.563
+0.563
0.0%
jan 1, 2013
0.378
-0.185
-32.79%
jan 1, 2014
0.298
-0.08
-21.18%
jan 1, 2015
0.632
+0.334
111.88%
Ranking of countries by current statistics by years
