This statistics in other country:
Timeline:
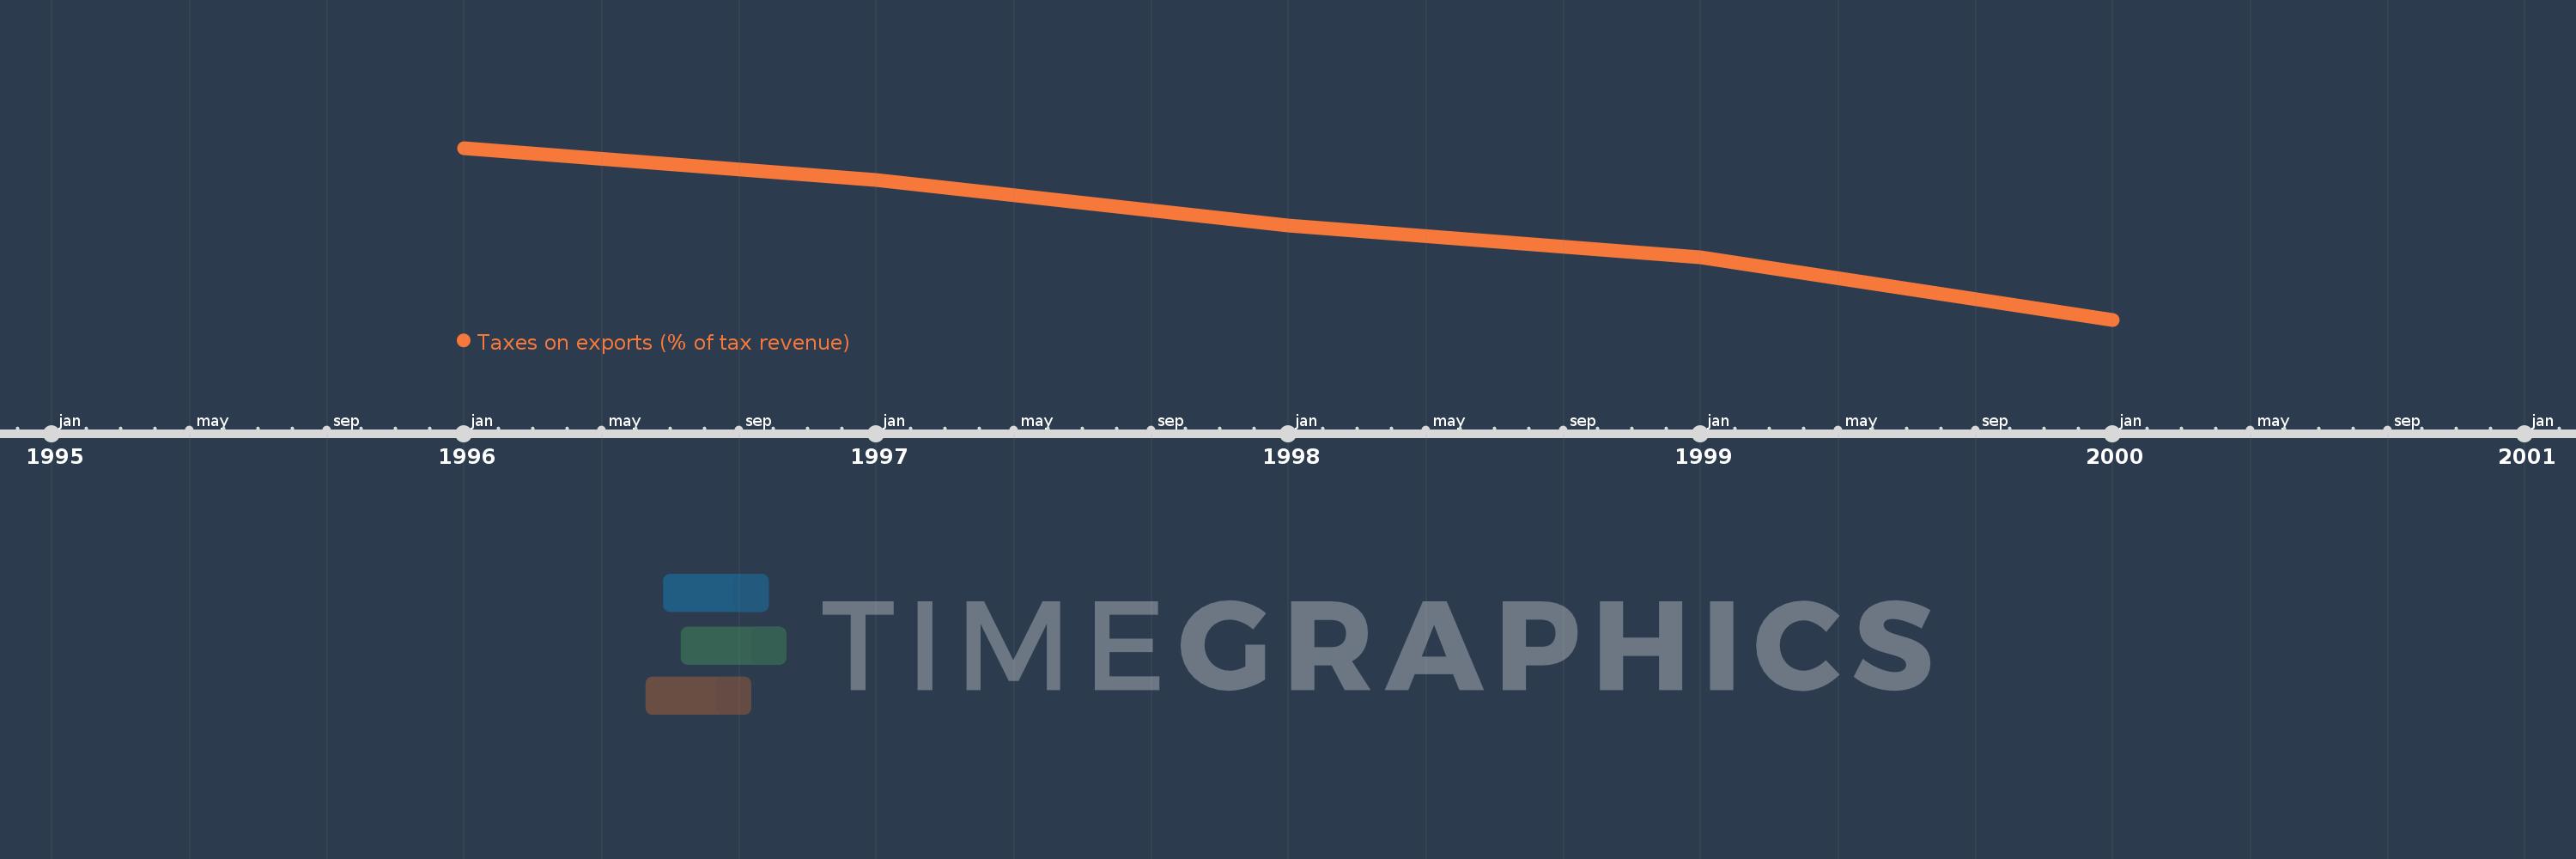
This timeline shows a graph from 1996 to 2000 of Latvia. No data until 1995. Number of actual observations by date: 5.
Source name:
World Development Indicators
Source organization:
International Monetary Fund, Government Finance Statistics Yearbook and data files.
Categories, topics:
Public Sector, Trade
Last updated:
apr 23, 2017
Indicators value changes by year
At the date of observation
Value
Absolute change
Change from previous value
jan 1, 1996
0.245
+0.245
0.0%
jan 1, 1997
0.2
-0.044
-18.1%
jan 1, 1998
0.136
-0.064
-31.98%
jan 1, 1999
0.091
-0.045
-33.25%
jan 1, 2000
0.003
-0.088
-96.7%
Ranking of countries by current statistics by years


Comments: