29
/
en
AIzaSyAYiBZKx7MnpbEhh9jyipgxe19OcubqV5w
April 1, 2024
196334
Mexico
MEX
true
2
1
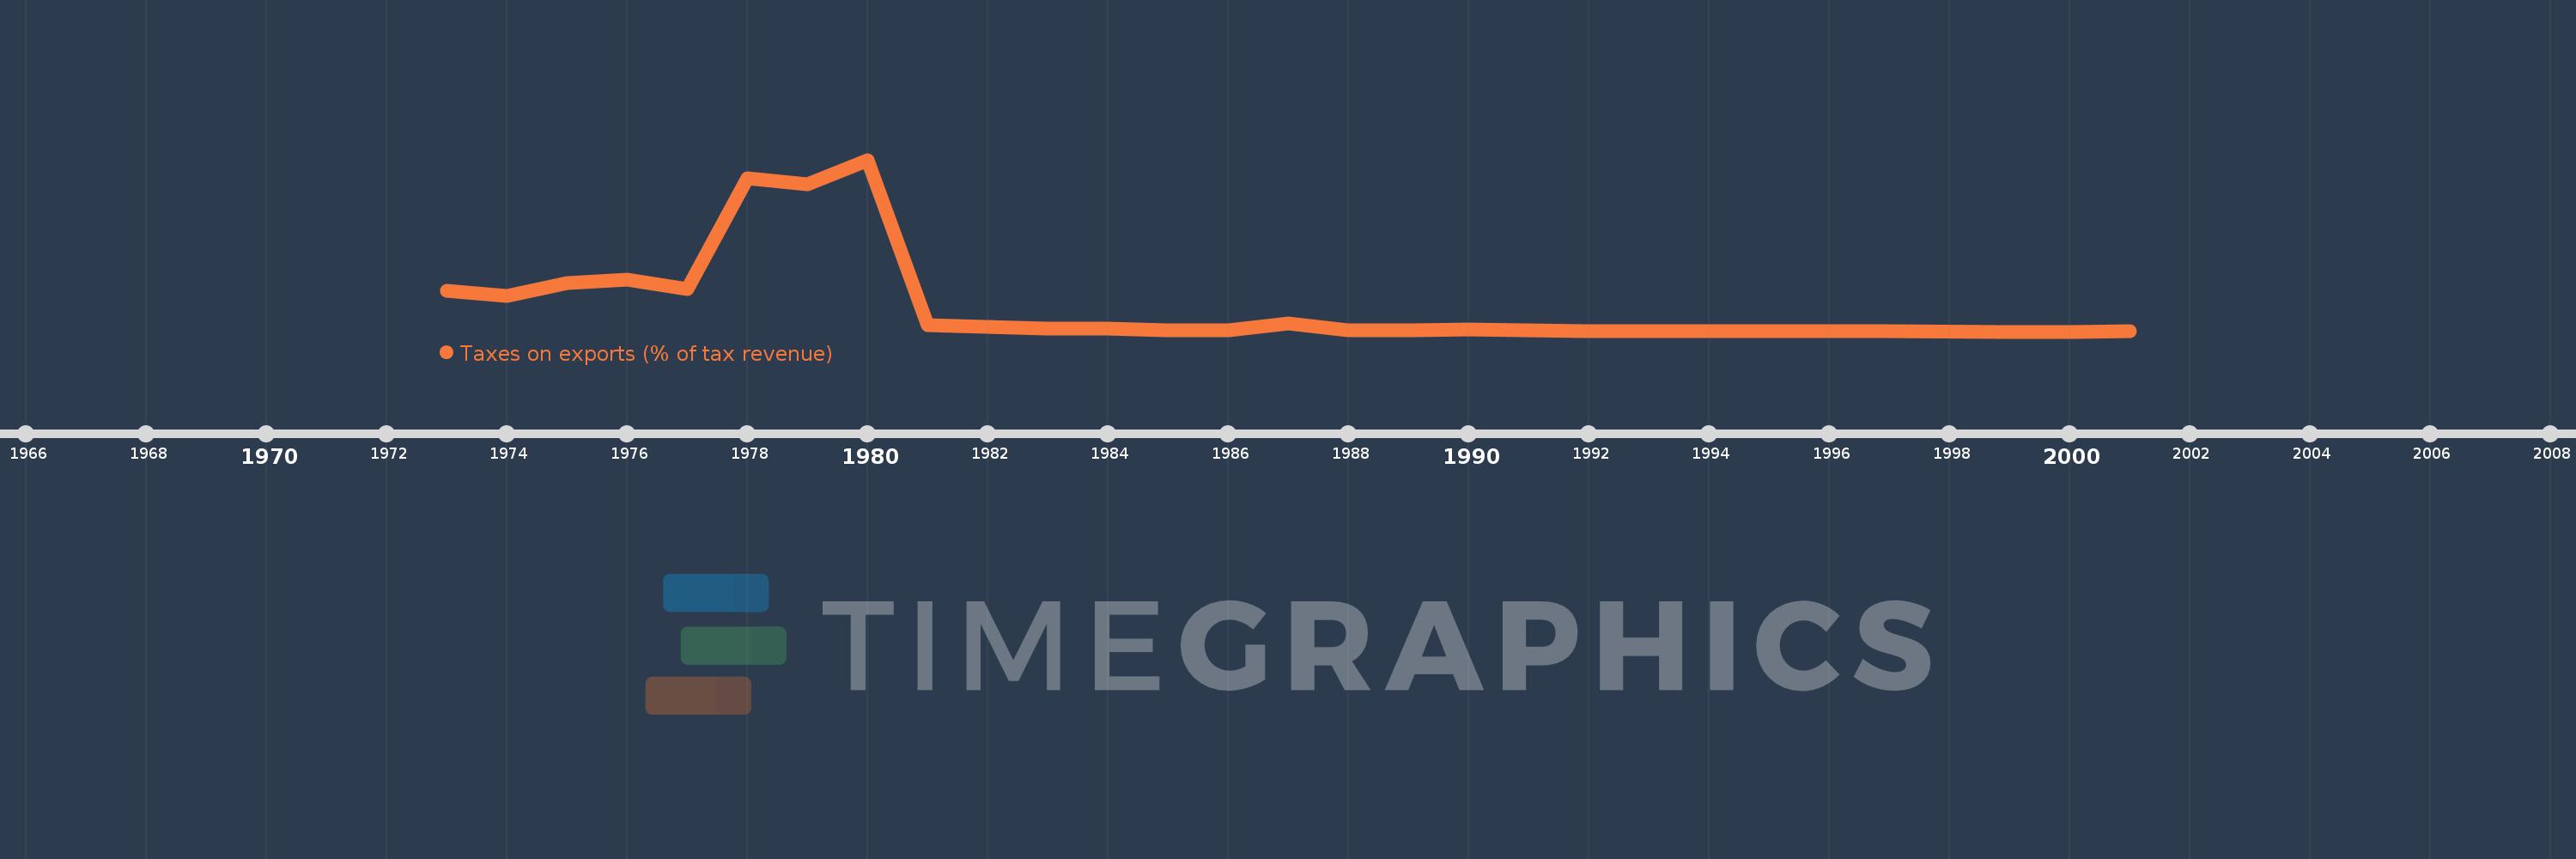
Taxes on exports (% of tax revenue)
2001,2000,1999,1997,1996,1995,1994,1993,1992,1991,1990,1989,1988,1987,1986,1985,1984,1983,1981,1980,1979,1978,1977,1976,1975,1974,1973
This statistics in other country:
Timeline:
This timeline shows a graph from 1973 to 2001 of Mexico. No data until 1972. Number of actual observations by date: 27.
Source name:
World Development Indicators
Source organization:
International Monetary Fund, Government Finance Statistics Yearbook and data files.
Categories, topics:
Public Sector, Trade
Last updated:
apr 23, 2017
Indicators value changes by year
At the date of observation
Value
Absolute change
Change from previous value
jan 1, 1973
2.326
+2.326
0.0%
jan 1, 1974
2.041
-0.285
-12.24%
jan 1, 1975
2.778
+0.737
36.11%
jan 1, 1976
2.97
+0.193
6.93%
jan 1, 1977
2.419
-0.551
-18.55%
jan 1, 1978
8.696
+6.276
259.42%
jan 1, 1979
8.367
-0.329
-3.78%
jan 1, 1980
9.77
+1.404
16.78%
jan 1, 1981
0.371
-9.399
-96.2%
jan 1, 1983
0.171
-0.2
-53.85%
jan 1, 1984
0.164
-0.007
-4.18%
jan 1, 1985
0.051
-0.113
-68.77%
jan 1, 1986
0.065
+0.014
26.41%
jan 1, 1987
0.481
+0.416
642.87%
jan 1, 1988
0.062
-0.419
-87.17%
jan 1, 1989
0.07
+0.008
13.48%
jan 1, 1990
0.136
+0.066
94.21%
jan 1, 1991
0.086
-0.05
-36.68%
jan 1, 1992
0.037
-0.049
-56.57%
jan 1, 1993
0.029
-0.008
-22.11%
jan 1, 1994
0.022
-0.007
-24.82%
jan 1, 1995
0.026
+0.005
20.7%
jan 1, 1996
0.032
+0.006
21.56%
jan 1, 1997
0.018
-0.014
-43.03%
jan 1, 1999
0.0
-0.018
-98.61%
jan 1, 2000
0.0
0.0
-20.58%
jan 1, 2001
0.001
+0.0
208.36%
Ranking of countries by current statistics by years


Comments: