29
/
en
AIzaSyAYiBZKx7MnpbEhh9jyipgxe19OcubqV5w
April 1, 2024
209824
New Zealand
NZL
true
2
1
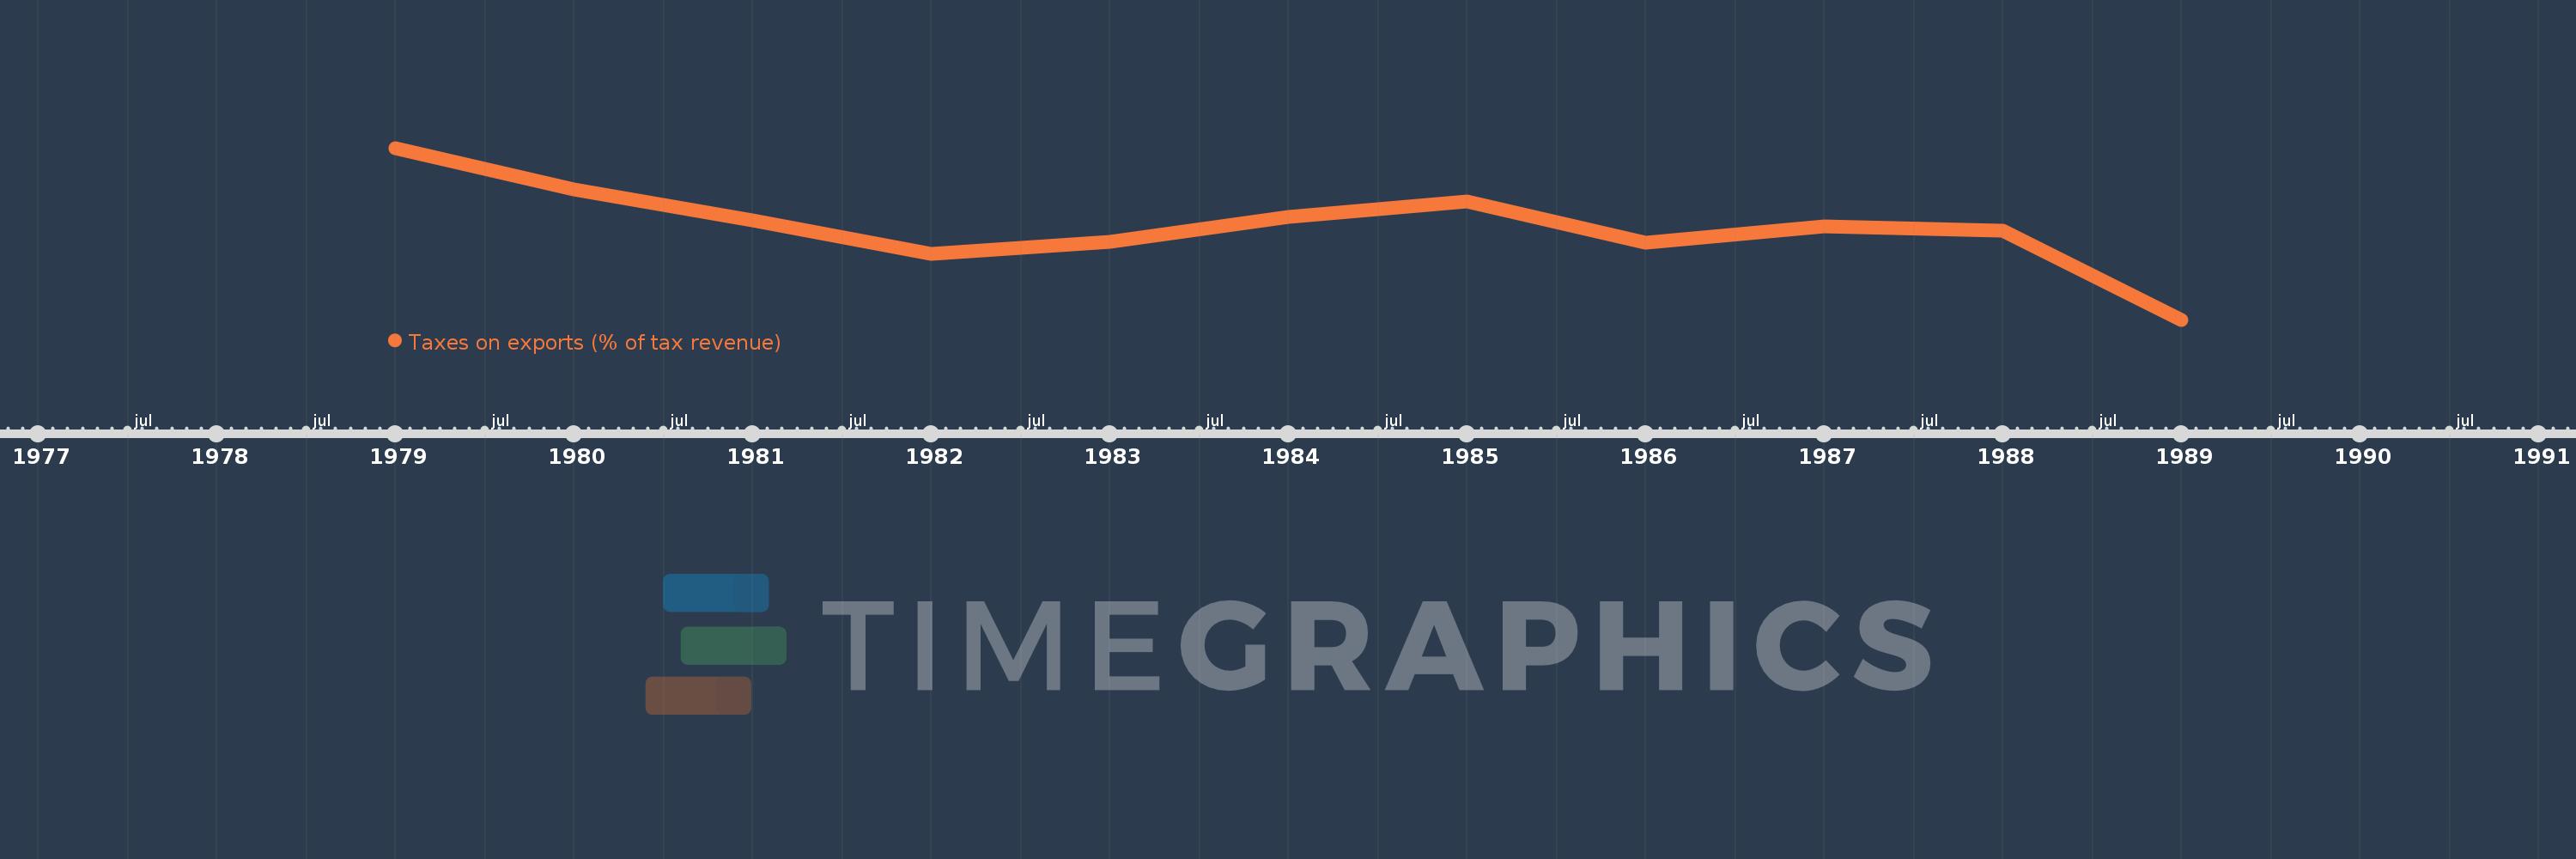
Taxes on exports (% of tax revenue)
1989,1988,1987,1986,1985,1984,1983,1982,1981,1980,1979
This statistics in other country:
Timeline:
This timeline shows a graph from 1979 to 1989 of New Zealand. No data until 1978. Number of actual observations by date: 11.
Source name:
World Development Indicators
Source organization:
International Monetary Fund, Government Finance Statistics Yearbook and data files.
Categories, topics:
Public Sector, Trade
Last updated:
apr 23, 2017
Indicators value changes by year
At the date of observation
Value
Absolute change
Change from previous value
jan 1, 1979
0.16
+0.16
0.0%
jan 1, 1980
0.133
-0.027
-17.1%
jan 1, 1981
0.113
-0.019
-14.57%
jan 1, 1982
0.091
-0.023
-19.87%
jan 1, 1983
0.099
+0.008
8.85%
jan 1, 1984
0.115
+0.016
16.01%
jan 1, 1985
0.125
+0.011
9.29%
jan 1, 1986
0.098
-0.028
-21.99%
jan 1, 1987
0.109
+0.011
11.16%
jan 1, 1988
0.106
-0.003
-2.36%
jan 1, 1989
0.048
-0.058
-54.78%
Ranking of countries by current statistics by years


Comments: