29
/
en
AIzaSyAYiBZKx7MnpbEhh9jyipgxe19OcubqV5w
April 1, 2024
199913
Mongolia
MNG
true
2
1
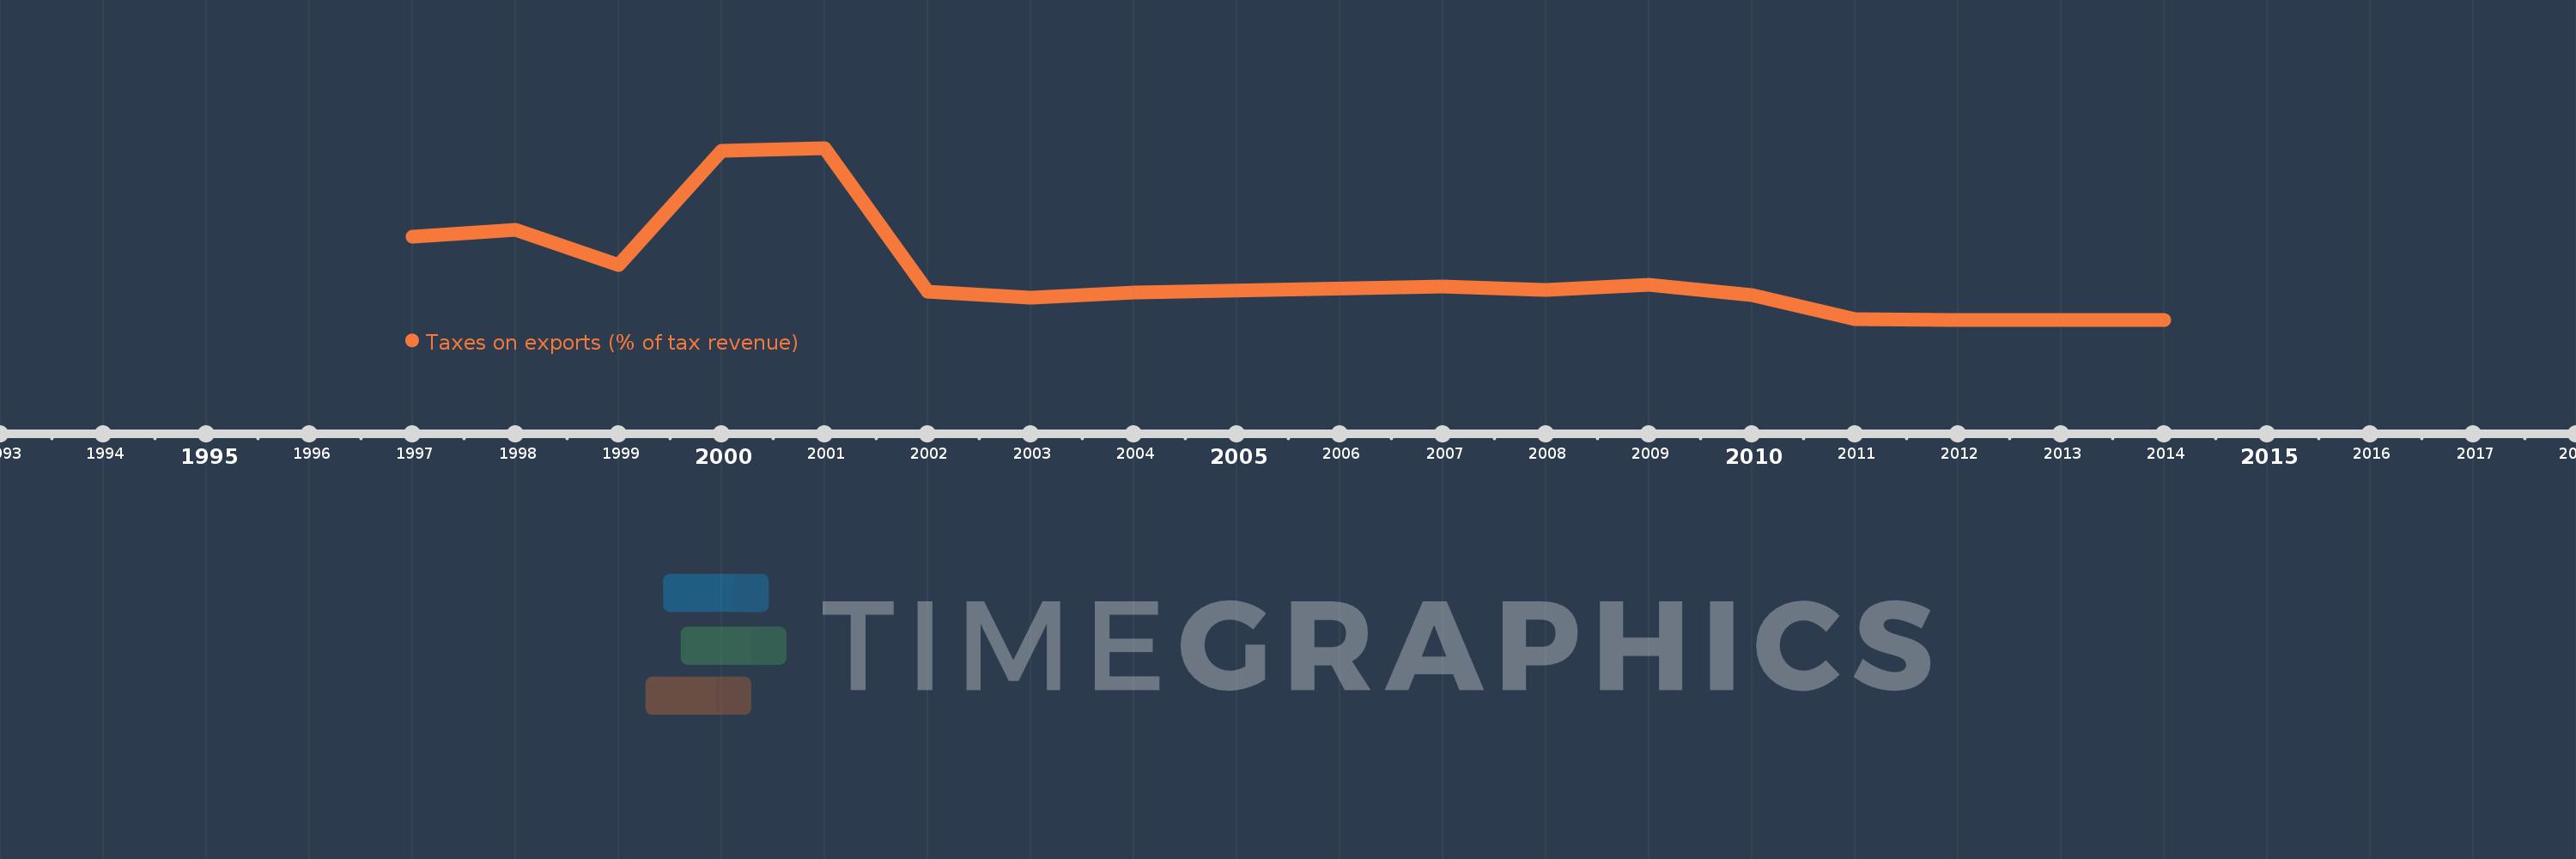
Taxes on exports (% of tax revenue)
2014,2013,2012,2011,2010,2009,2008,2007,2004,2003,2002,2001,2000,1999,1998,1997
This statistics in other country:
Timeline:
This timeline shows a graph from 1997 to 2014 of Mongolia. No data until 1996. Number of actual observations by date: 16.
Source name:
World Development Indicators
Source organization:
International Monetary Fund, Government Finance Statistics Yearbook and data files.
Categories, topics:
Public Sector, Trade
Last updated:
apr 23, 2017
Indicators value changes by year
At the date of observation
Value
Absolute change
Change from previous value
jan 1, 1997
1.472
+1.472
0.0%
jan 1, 1998
1.581
+0.109
7.39%
jan 1, 1999
0.962
-0.619
-39.16%
jan 1, 2000
2.983
+2.022
210.22%
jan 1, 2001
3.026
+0.043
1.44%
jan 1, 2002
0.503
-2.523
-83.37%
jan 1, 2003
0.398
-0.105
-20.9%
jan 1, 2004
0.481
+0.083
20.92%
jan 1, 2007
0.592
+0.11
22.9%
jan 1, 2008
0.534
-0.057
-9.67%
jan 1, 2009
0.619
+0.084
15.8%
jan 1, 2010
0.436
-0.183
-29.5%
jan 1, 2011
0.01
-0.426
-97.72%
jan 1, 2012
0.008
-0.002
-23.21%
jan 1, 2013
0.008
+0.0
0.2%
jan 1, 2014
0.006
-0.001
-18.1%
Ranking of countries by current statistics by years


Comments: