29
/
en
AIzaSyAYiBZKx7MnpbEhh9jyipgxe19OcubqV5w
April 1, 2024
255871
Swaziland
SWZ
true
2
1
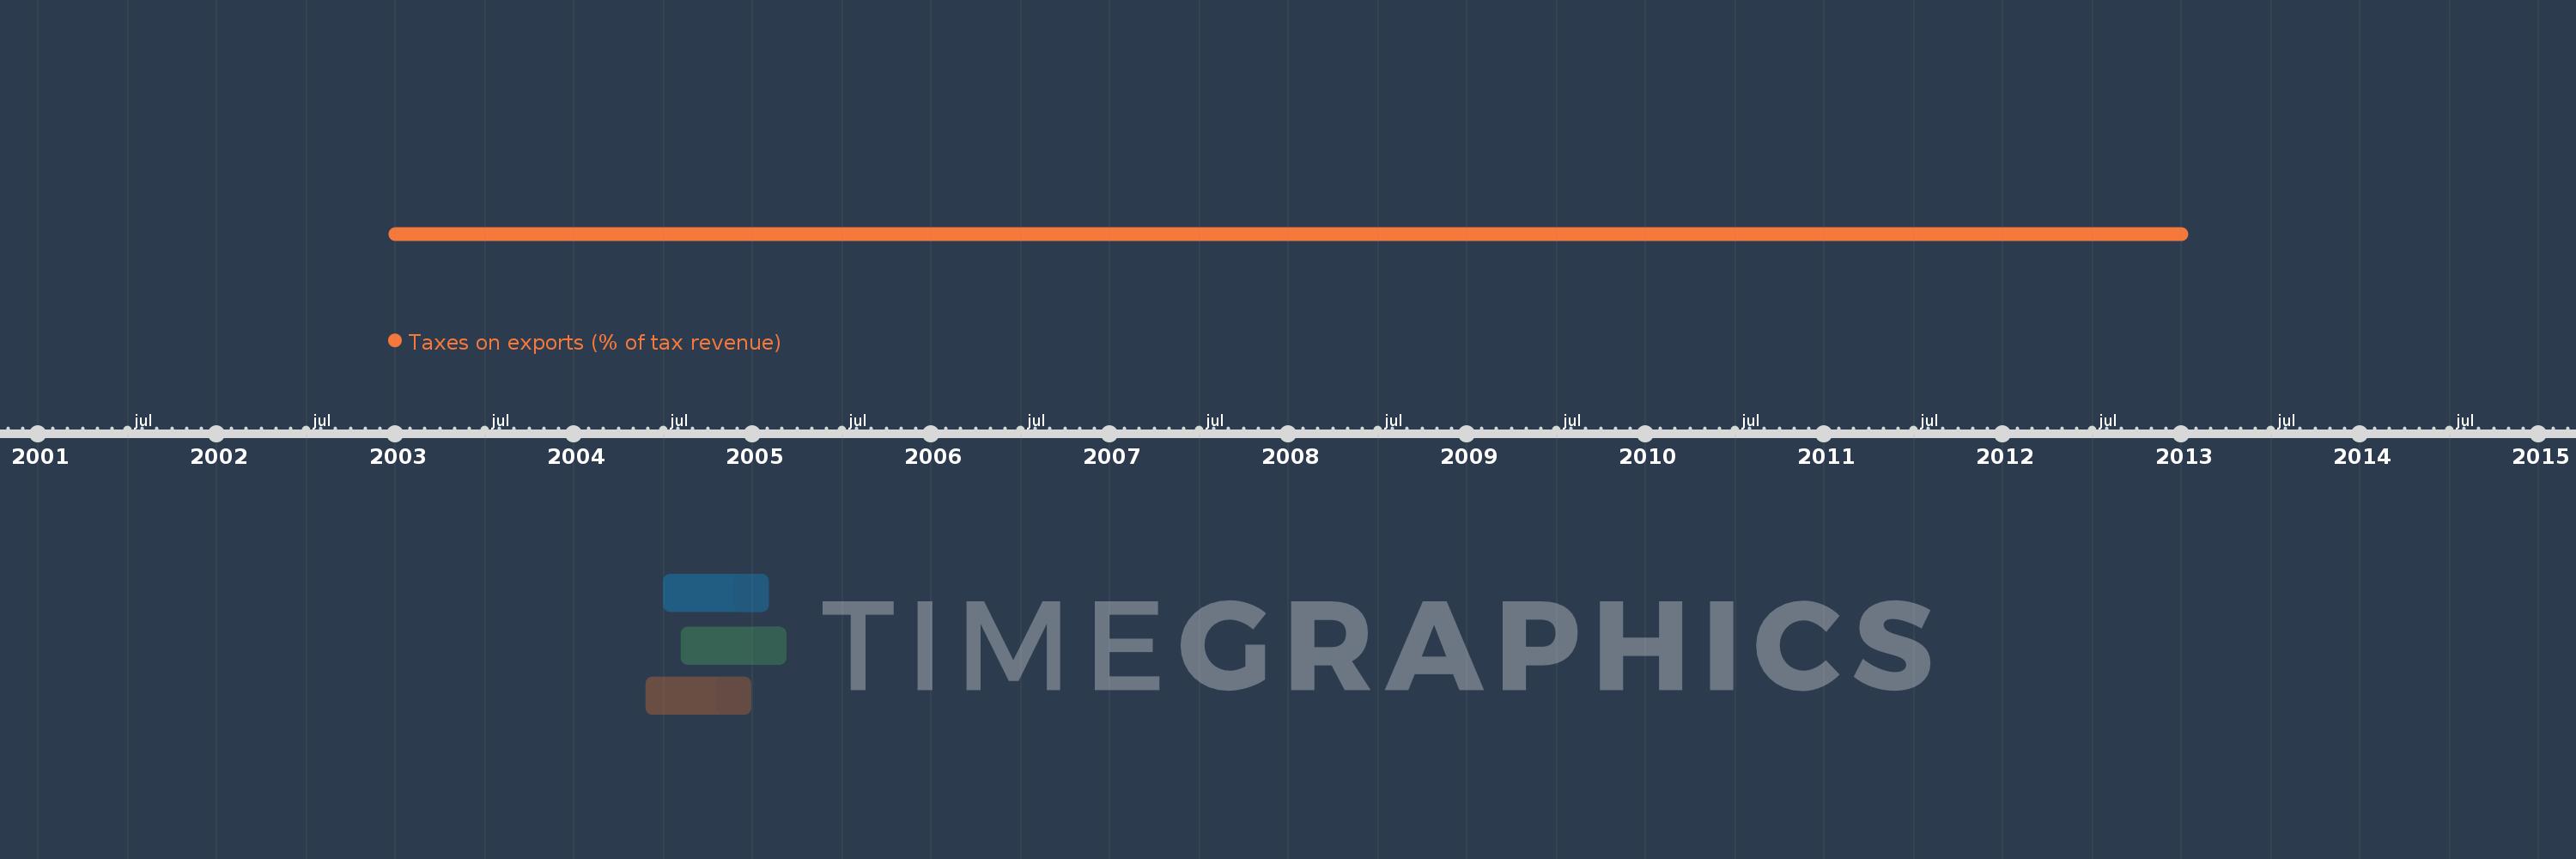
Taxes on exports (% of tax revenue)
2013,2012,2011,2010,2009,2008,2007,2006,2005,2004,2003
This statistics in other country:
Timeline:
This timeline shows a graph from 2003 to 2013 of Swaziland. No data until 2002. Number of actual observations by date: 11.
Source name:
World Development Indicators
Source organization:
International Monetary Fund, Government Finance Statistics Yearbook and data files.
Categories, topics:
Public Sector, Trade
Last updated:
apr 23, 2017
Indicators value changes by year
At the date of observation
Value
Absolute change
Change from previous value
jan 1, 2004
0.0
+0.0
143.26%
jan 1, 2005
0.0
0.0
-73.38%
jan 1, 2006
0.0
+0.0
500.05%
jan 1, 2007
0.0
0.0
-51.98%
jan 1, 2008
0.0
+0.0
127.78%
jan 1, 2009
0.0
0.0
-77.58%
jan 1, 2010
0.0
+0.0
76.34%
jan 1, 2011
0.0
0.0
-70.51%
jan 1, 2012
0.0
+0.0
173.3%
jan 1, 2013
0.0
0.0
-49.61%
Ranking of countries by current statistics by years


Comments: