29
/
en
AIzaSyAYiBZKx7MnpbEhh9jyipgxe19OcubqV5w
April 1, 2024
24653
Caribbean small states
CSS
false
2
1
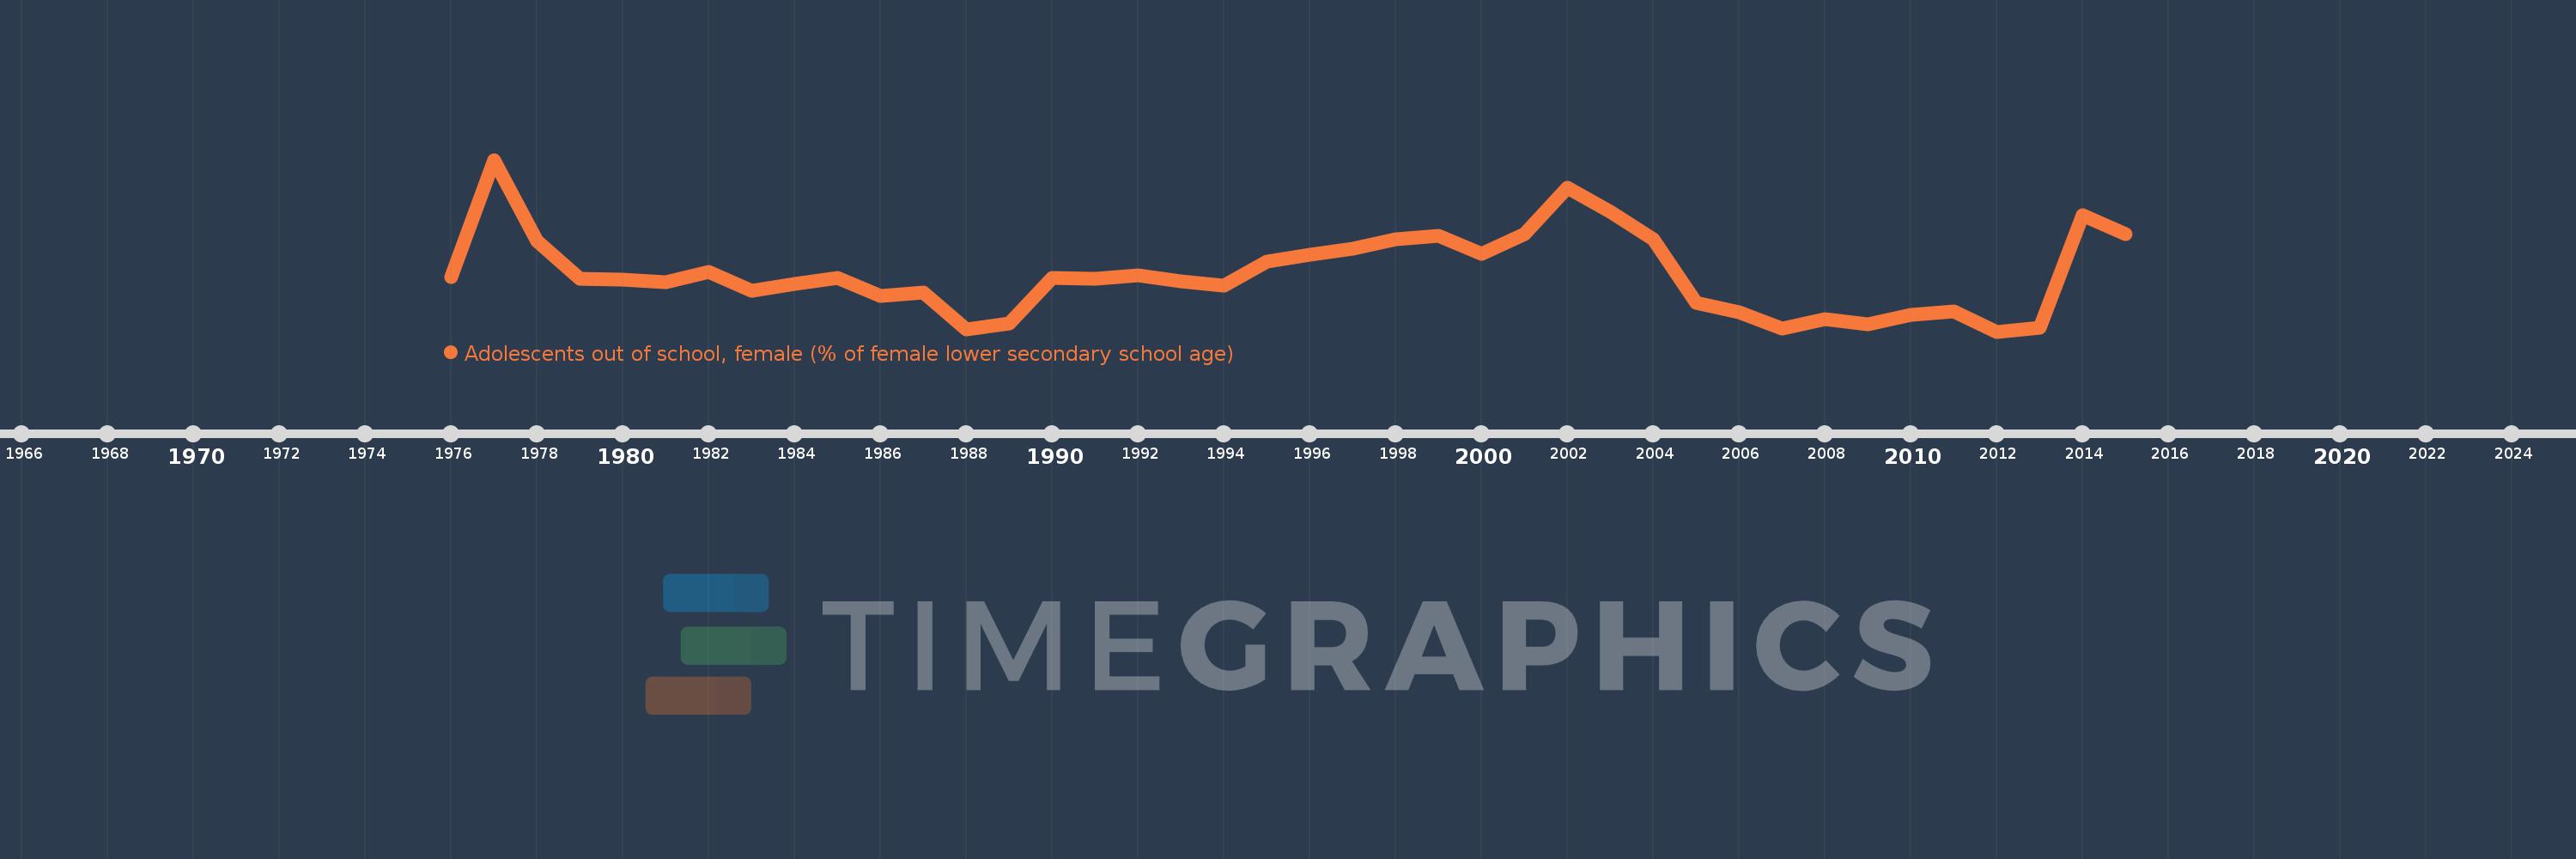
Adolescents out of school, female (% of female lower secondary school age)
2015,2014,2013,2012,2011,2010,2009,2008,2007,2006,2005,2004,2003,2002,2001,2000,1999,1998,1997,1996,1995,1994,1993,1992,1991,1990,1989,1988,1987,1986,1985,1984,1983,1982,1981,1980,1979,1978,1977,1976
This statistics in other country:
AfghanistanAlbaniaAlgeriaAngolaAntigua and BarbudaArab WorldArgentinaArmeniaArubaAustraliaAzerbaijanBahamas, TheBahrainBangladeshBarbadosBelarusBelgiumBelizeBeninBermudaBhutanBoliviaBotswanaBrazilBrunei DarussalamBulgariaBurkina FasoBurundiCabo VerdeCambodiaCameroonCanadaCaribbean small statesCentral African RepublicCentral Europe and the BalticsChadChileColombiaComorosCongo, Dem. Rep.Congo, Rep.Costa RicaCroatiaCubaCyprusDenmarkDjiboutiDominicaDominican RepublicEarly-demographic dividendEast Asia & PacificEast Asia & Pacific (excluding high income)East Asia & Pacific (IDA & IBRD countries)EcuadorEgypt, Arab Rep.El SalvadorEritreaEstoniaEthiopiaEuro areaEurope & Central AsiaEurope & Central Asia (excluding high income)Europe & Central Asia (IDA & IBRD countries)European UnionFijiFinlandFragile and conflict affected situationsFranceGambia, TheGeorgiaGhanaGreeceGrenadaGuatemalaGuineaGuinea-BissauGuyanaHeavily indebted poor countries (HIPC)High incomeHondurasHong Kong SAR, ChinaHungaryIBRD onlyIcelandIDA & IBRD totalIDA blendIDA onlyIDA totalIndiaIndonesiaIran, Islamic Rep.IraqIrelandItalyJamaicaJordanKazakhstanKenyaKiribatiKorea, Rep.KuwaitKyrgyz RepublicLao PDRLate-demographic dividendLatin America & Caribbean Latin America & Caribbean (excluding high income)Latin America & the Caribbean (IDA & IBRD countries)LatviaLeast developed countries: UN classificationLebanonLesothoLibyaLiechtensteinLithuaniaLow & middle incomeLow incomeLower middle incomeLuxembourgMacao SAR, ChinaMacedonia, FYRMadagascarMalawiMaldivesMaliMaltaMauritaniaMauritiusMexicoMiddle East & North AfricaMiddle East & North Africa (excluding high income)Middle East & North Africa (IDA & IBRD countries)Middle incomeMoldovaMongoliaMoroccoMozambiqueMyanmarNamibiaNauruNetherlandsNew ZealandNicaraguaNigerNorth AmericaNorwayOECD membersOmanOther small statesPacific island small statesPakistanPanamaParaguayPeruPhilippinesPolandPortugalPost-demographic dividendPre-demographic dividendPuerto RicoQatarRomaniaRussian FederationSamoaSao Tome and PrincipeSaudi ArabiaSenegalSerbiaSeychellesSierra LeoneSloveniaSmall statesSolomon IslandsSomaliaSouth AfricaSouth AsiaSouth Asia (IDA & IBRD)SpainSri LankaSt. Kitts and NevisSt. LuciaSt. Vincent and the GrenadinesSub-Saharan Africa Sub-Saharan Africa (excluding high income)Sub-Saharan Africa (IDA & IBRD countries)SudanSurinameSwazilandSwedenSwitzerlandSyrian Arab RepublicTajikistanThailandTimor-LesteTogoTongaTrinidad and TobagoTunisiaTurkeyTuvaluUgandaUkraineUnited Arab EmiratesUnited KingdomUnited StatesUpper middle incomeUruguayVanuatuVenezuela, RBWest Bank and GazaWorldYemen, Rep.Zimbabwe Timeline:
This timeline shows a graph from 1976 to 2015 of Caribbean small states. No data until 1975. Number of actual observations by date: 40.
Source name:
World Development Indicators
Source organization:
United Nations Educational, Scientific, and Cultural Organization (UNESCO) Institute for Statistics.
Categories, topics:
Education
Last updated:
apr 23, 2017
Indicators value changes by year
Maximum:
13.851
jan 1, 1977
At the date of observation
Value
Absolute change
Change from previous value
jan 1, 1976
9.147
+9.147
0.0%
jan 1, 1977
13.851
+4.705
51.43%
jan 1, 1978
10.606
-3.245
-23.43%
jan 1, 1979
9.103
-1.503
-14.17%
jan 1, 1980
9.047
-0.056
-0.62%
jan 1, 1981
8.937
-0.11
-1.21%
jan 1, 1982
9.365
+0.428
4.79%
jan 1, 1983
8.606
-0.76
-8.11%
jan 1, 1984
8.873
+0.267
3.1%
jan 1, 1985
9.108
+0.235
2.65%
jan 1, 1986
8.397
-0.711
-7.8%
jan 1, 1987
8.549
+0.151
1.8%
jan 1, 1988
7.062
-1.486
-17.39%
jan 1, 1989
7.309
+0.246
3.49%
jan 1, 1990
9.108
+1.8
24.62%
jan 1, 1991
9.095
-0.013
-0.15%
jan 1, 1992
9.22
+0.125
1.37%
jan 1, 1993
8.972
-0.248
-2.69%
jan 1, 1994
8.815
-0.157
-1.75%
jan 1, 1995
9.776
+0.961
10.91%
jan 1, 1996
10.035
+0.258
2.64%
jan 1, 1997
10.306
+0.271
2.71%
jan 1, 1998
10.677
+0.371
3.6%
jan 1, 1999
10.819
+0.142
1.33%
jan 1, 2000
10.095
-0.724
-6.69%
jan 1, 2001
10.862
+0.767
7.6%
jan 1, 2002
12.733
+1.871
17.23%
jan 1, 2003
11.756
-0.977
-7.68%
jan 1, 2004
10.674
-1.082
-9.2%
jan 1, 2005
8.134
-2.539
-23.79%
jan 1, 2006
7.757
-0.377
-4.64%
jan 1, 2007
7.111
-0.646
-8.32%
jan 1, 2008
7.489
+0.378
5.31%
jan 1, 2009
7.264
-0.225
-3.01%
jan 1, 2010
7.649
+0.385
5.3%
jan 1, 2011
7.777
+0.128
1.67%
jan 1, 2012
6.974
-0.803
-10.33%
jan 1, 2013
7.119
+0.145
2.08%
jan 1, 2014
11.627
+4.508
63.32%
jan 1, 2015
10.862
-0.765
-6.58%
Ranking of countries by current statistics by years


Comments: