29
/
en
AIzaSyAYiBZKx7MnpbEhh9jyipgxe19OcubqV5w
April 1, 2024
115555
Cuba
CUB
true
2
1
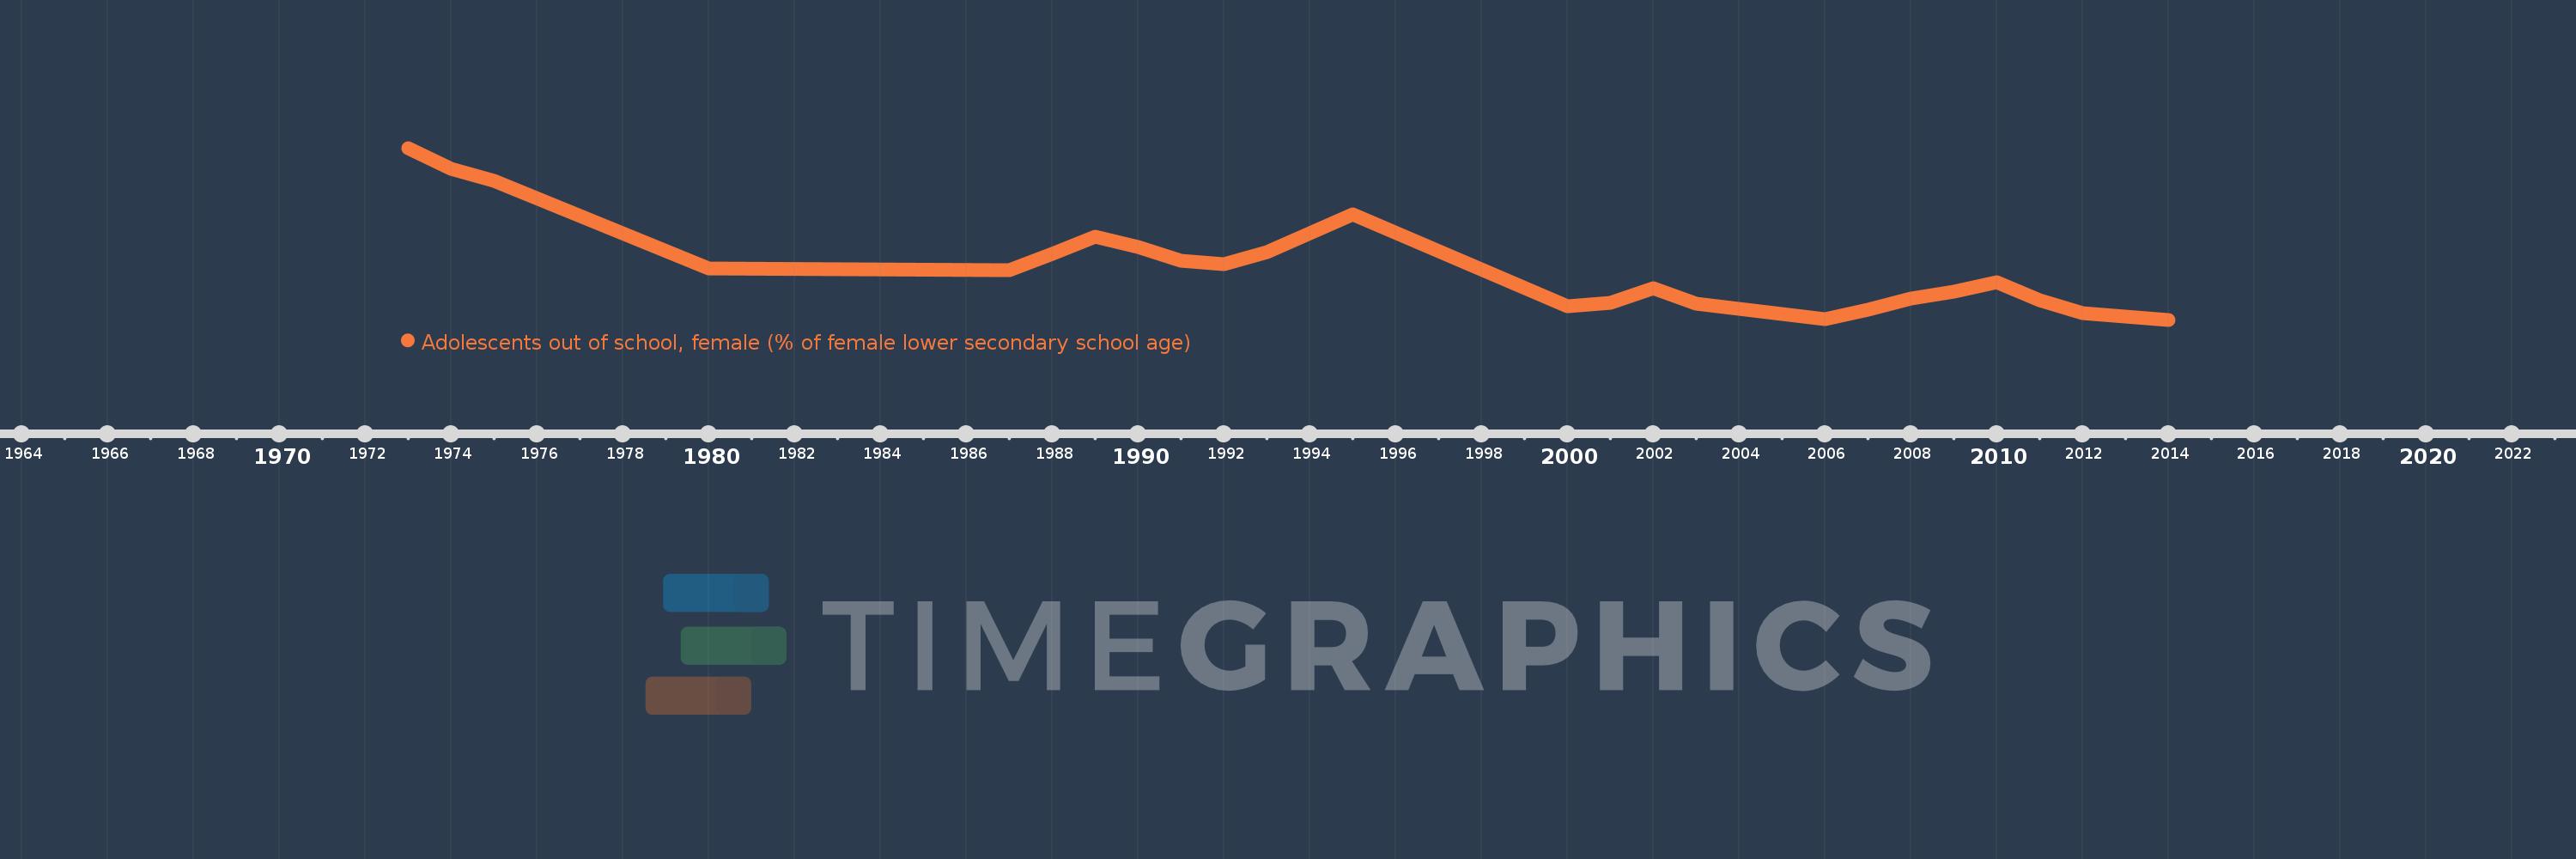
Adolescents out of school, female (% of female lower secondary school age)
2014,2012,2011,2010,2009,2008,2007,2006,2003,2002,2001,2000,1995,1993,1992,1991,1990,1989,1988,1987,1980,1975,1974,1973
This statistics in other country:
AfghanistanAlbaniaAlgeriaAngolaAntigua and BarbudaArab WorldArgentinaArmeniaArubaAustraliaAzerbaijanBahamas, TheBahrainBangladeshBarbadosBelarusBelgiumBelizeBeninBermudaBhutanBoliviaBotswanaBrazilBrunei DarussalamBulgariaBurkina FasoBurundiCabo VerdeCambodiaCameroonCanadaCaribbean small statesCentral African RepublicCentral Europe and the BalticsChadChileColombiaComorosCongo, Dem. Rep.Congo, Rep.Costa RicaCroatiaCubaCyprusDenmarkDjiboutiDominicaDominican RepublicEarly-demographic dividendEast Asia & PacificEast Asia & Pacific (excluding high income)East Asia & Pacific (IDA & IBRD countries)EcuadorEgypt, Arab Rep.El SalvadorEritreaEstoniaEthiopiaEuro areaEurope & Central AsiaEurope & Central Asia (excluding high income)Europe & Central Asia (IDA & IBRD countries)European UnionFijiFinlandFragile and conflict affected situationsFranceGambia, TheGeorgiaGhanaGreeceGrenadaGuatemalaGuineaGuinea-BissauGuyanaHeavily indebted poor countries (HIPC)High incomeHondurasHong Kong SAR, ChinaHungaryIBRD onlyIcelandIDA & IBRD totalIDA blendIDA onlyIDA totalIndiaIndonesiaIran, Islamic Rep.IraqIrelandItalyJamaicaJordanKazakhstanKenyaKiribatiKorea, Rep.KuwaitKyrgyz RepublicLao PDRLate-demographic dividendLatin America & Caribbean Latin America & Caribbean (excluding high income)Latin America & the Caribbean (IDA & IBRD countries)LatviaLeast developed countries: UN classificationLebanonLesothoLibyaLiechtensteinLithuaniaLow & middle incomeLow incomeLower middle incomeLuxembourgMacao SAR, ChinaMacedonia, FYRMadagascarMalawiMaldivesMaliMaltaMauritaniaMauritiusMexicoMiddle East & North AfricaMiddle East & North Africa (excluding high income)Middle East & North Africa (IDA & IBRD countries)Middle incomeMoldovaMongoliaMoroccoMozambiqueMyanmarNamibiaNauruNetherlandsNew ZealandNicaraguaNigerNorth AmericaNorwayOECD membersOmanOther small statesPacific island small statesPakistanPanamaParaguayPeruPhilippinesPolandPortugalPost-demographic dividendPre-demographic dividendPuerto RicoQatarRomaniaRussian FederationSamoaSao Tome and PrincipeSaudi ArabiaSenegalSerbiaSeychellesSierra LeoneSloveniaSmall statesSolomon IslandsSomaliaSouth AfricaSouth AsiaSouth Asia (IDA & IBRD)SpainSri LankaSt. Kitts and NevisSt. LuciaSt. Vincent and the GrenadinesSub-Saharan Africa Sub-Saharan Africa (excluding high income)Sub-Saharan Africa (IDA & IBRD countries)SudanSurinameSwazilandSwedenSwitzerlandSyrian Arab RepublicTajikistanThailandTimor-LesteTogoTongaTrinidad and TobagoTunisiaTurkeyTuvaluUgandaUkraineUnited Arab EmiratesUnited KingdomUnited StatesUpper middle incomeUruguayVanuatuVenezuela, RBWest Bank and GazaWorldYemen, Rep.Zimbabwe Timeline:
This timeline shows a graph from 1973 to 2014 of Cuba. No data until 1972. Number of actual observations by date: 24.
Source name:
World Development Indicators
Source organization:
United Nations Educational, Scientific, and Cultural Organization (UNESCO) Institute for Statistics.
Categories, topics:
Education
Last updated:
apr 23, 2017
Indicators value changes by year
Maximum:
30.604
jan 1, 1973
At the date of observation
Value
Absolute change
Change from previous value
jan 1, 1973
30.604
+30.604
0.0%
jan 1, 1974
26.962
-3.641
-11.9%
jan 1, 1975
24.868
-2.095
-7.77%
jan 1, 1980
9.344
-15.524
-62.43%
jan 1, 1987
8.953
-0.391
-4.19%
jan 1, 1988
11.874
+2.921
32.63%
jan 1, 1989
14.992
+3.118
26.26%
jan 1, 1990
13.124
-1.868
-12.46%
jan 1, 1991
10.72
-2.403
-18.31%
jan 1, 1992
10.109
-0.611
-5.7%
jan 1, 1993
12.183
+2.073
20.51%
jan 1, 1995
18.871
+6.688
54.9%
jan 1, 2000
2.632
-16.239
-86.05%
jan 1, 2001
3.322
+0.69
26.23%
jan 1, 2002
5.851
+2.529
76.13%
jan 1, 2003
3.156
-2.695
-46.06%
jan 1, 2006
0.309
-2.847
-90.2%
jan 1, 2007
1.987
+1.678
542.61%
jan 1, 2008
4.074
+2.086
104.99%
jan 1, 2009
5.224
+1.151
28.25%
jan 1, 2010
6.871
+1.647
31.53%
jan 1, 2011
3.78
-3.091
-44.99%
jan 1, 2012
1.483
-2.297
-60.78%
jan 1, 2014
0.261
-1.221
-82.38%
Ranking of countries by current statistics by years


Comments: