29
/
en
AIzaSyAYiBZKx7MnpbEhh9jyipgxe19OcubqV5w
April 1, 2024
56017
Small states
SST
false
2
1
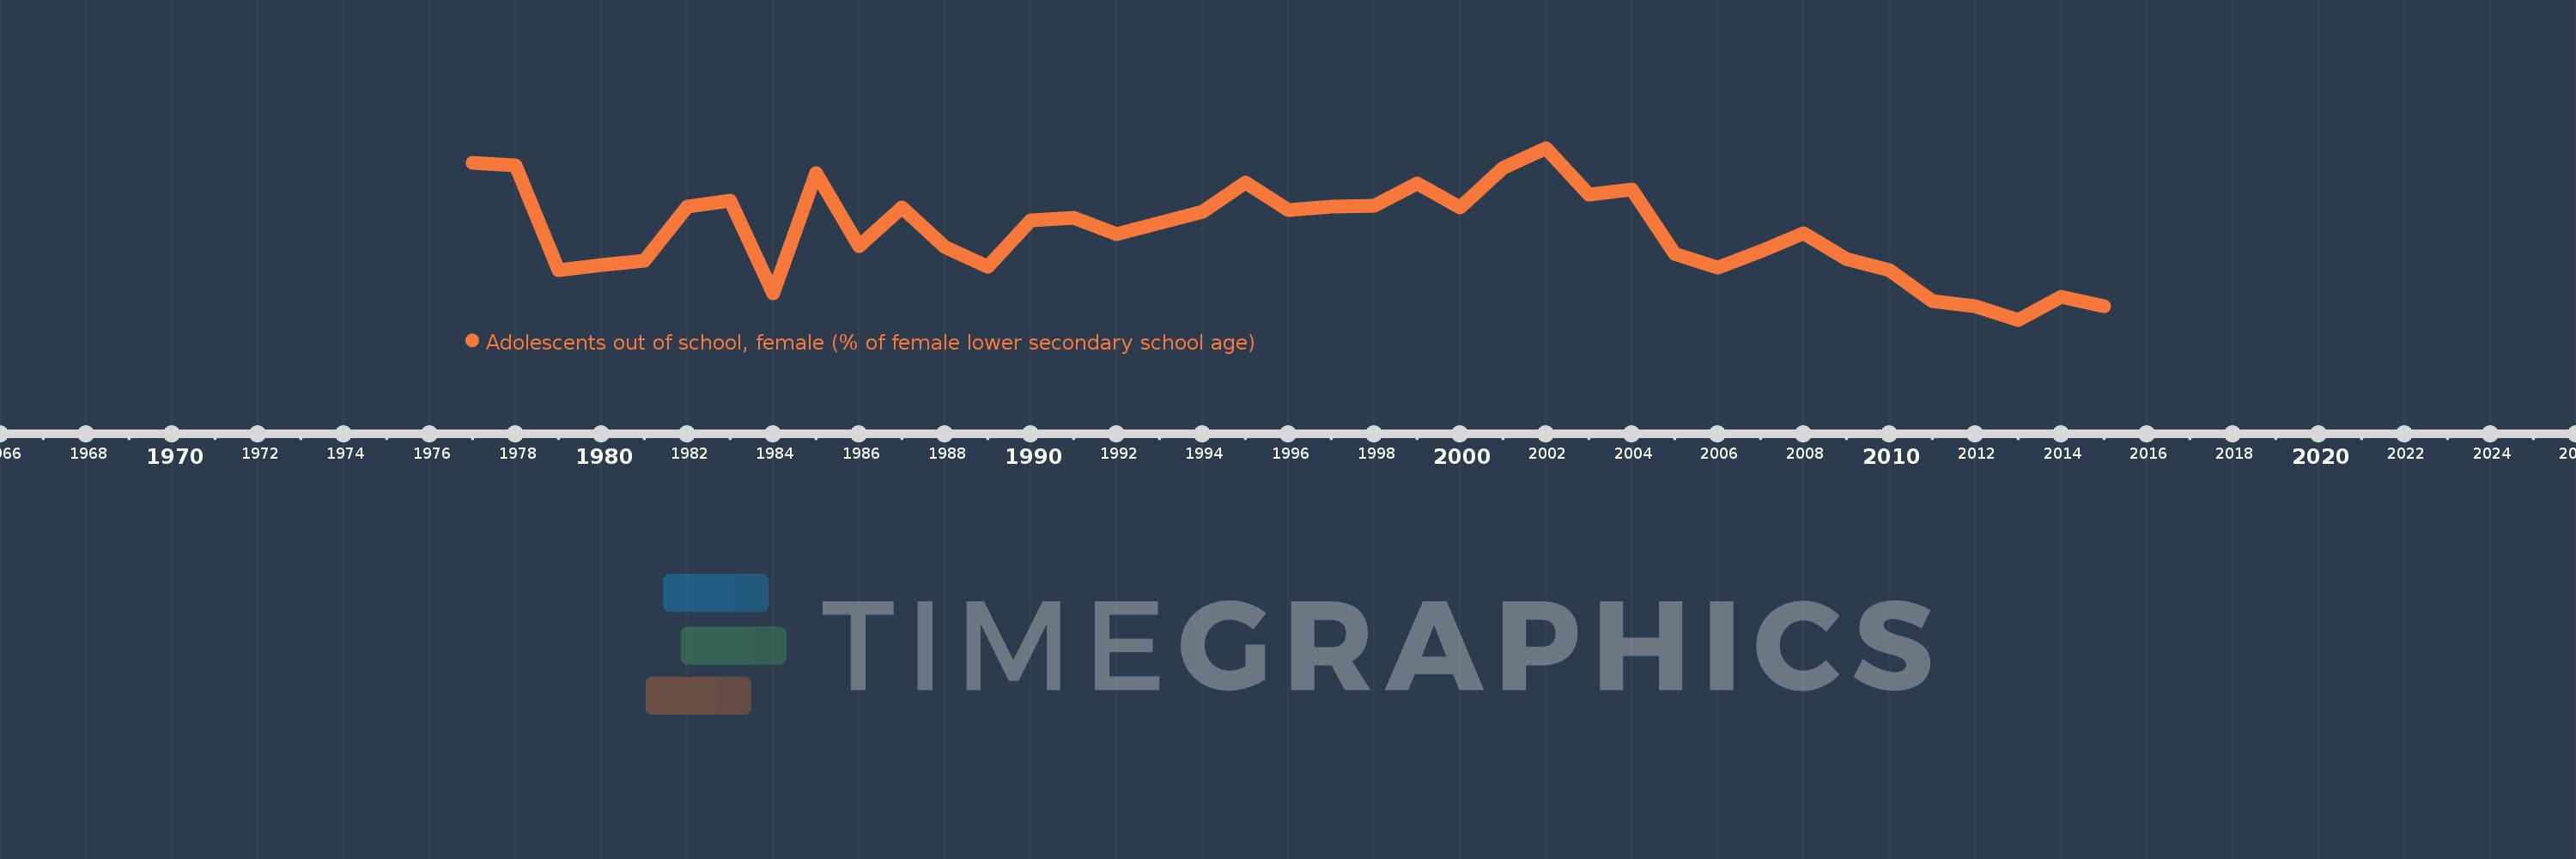
Adolescents out of school, female (% of female lower secondary school age)
2015,2014,2013,2012,2011,2010,2009,2008,2007,2006,2005,2004,2003,2002,2001,2000,1999,1998,1997,1996,1995,1994,1993,1992,1991,1990,1989,1988,1987,1986,1985,1984,1983,1982,1981,1980,1979,1978,1977
This statistics in other country:
AfghanistanAlbaniaAlgeriaAngolaAntigua and BarbudaArab WorldArgentinaArmeniaArubaAustraliaAzerbaijanBahamas, TheBahrainBangladeshBarbadosBelarusBelgiumBelizeBeninBermudaBhutanBoliviaBotswanaBrazilBrunei DarussalamBulgariaBurkina FasoBurundiCabo VerdeCambodiaCameroonCanadaCaribbean small statesCentral African RepublicCentral Europe and the BalticsChadChileColombiaComorosCongo, Dem. Rep.Congo, Rep.Costa RicaCroatiaCubaCyprusDenmarkDjiboutiDominicaDominican RepublicEarly-demographic dividendEast Asia & PacificEast Asia & Pacific (excluding high income)East Asia & Pacific (IDA & IBRD countries)EcuadorEgypt, Arab Rep.El SalvadorEritreaEstoniaEthiopiaEuro areaEurope & Central AsiaEurope & Central Asia (excluding high income)Europe & Central Asia (IDA & IBRD countries)European UnionFijiFinlandFragile and conflict affected situationsFranceGambia, TheGeorgiaGhanaGreeceGrenadaGuatemalaGuineaGuinea-BissauGuyanaHeavily indebted poor countries (HIPC)High incomeHondurasHong Kong SAR, ChinaHungaryIBRD onlyIcelandIDA & IBRD totalIDA blendIDA onlyIDA totalIndiaIndonesiaIran, Islamic Rep.IraqIrelandItalyJamaicaJordanKazakhstanKenyaKiribatiKorea, Rep.KuwaitKyrgyz RepublicLao PDRLate-demographic dividendLatin America & Caribbean Latin America & Caribbean (excluding high income)Latin America & the Caribbean (IDA & IBRD countries)LatviaLeast developed countries: UN classificationLebanonLesothoLibyaLiechtensteinLithuaniaLow & middle incomeLow incomeLower middle incomeLuxembourgMacao SAR, ChinaMacedonia, FYRMadagascarMalawiMaldivesMaliMaltaMauritaniaMauritiusMexicoMiddle East & North AfricaMiddle East & North Africa (excluding high income)Middle East & North Africa (IDA & IBRD countries)Middle incomeMoldovaMongoliaMoroccoMozambiqueMyanmarNamibiaNauruNetherlandsNew ZealandNicaraguaNigerNorth AmericaNorwayOECD membersOmanOther small statesPacific island small statesPakistanPanamaParaguayPeruPhilippinesPolandPortugalPost-demographic dividendPre-demographic dividendPuerto RicoQatarRomaniaRussian FederationSamoaSao Tome and PrincipeSaudi ArabiaSenegalSerbiaSeychellesSierra LeoneSloveniaSmall statesSolomon IslandsSomaliaSouth AfricaSouth AsiaSouth Asia (IDA & IBRD)SpainSri LankaSt. Kitts and NevisSt. LuciaSt. Vincent and the GrenadinesSub-Saharan Africa Sub-Saharan Africa (excluding high income)Sub-Saharan Africa (IDA & IBRD countries)SudanSurinameSwazilandSwedenSwitzerlandSyrian Arab RepublicTajikistanThailandTimor-LesteTogoTongaTrinidad and TobagoTunisiaTurkeyTuvaluUgandaUkraineUnited Arab EmiratesUnited KingdomUnited StatesUpper middle incomeUruguayVanuatuVenezuela, RBWest Bank and GazaWorldYemen, Rep.Zimbabwe Timeline:
This timeline shows a graph from 1977 to 2015 of Small states. No data until 1976. Number of actual observations by date: 39.
Source name:
World Development Indicators
Source organization:
United Nations Educational, Scientific, and Cultural Organization (UNESCO) Institute for Statistics.
Categories, topics:
Education
Last updated:
apr 23, 2017
Indicators value changes by year
Maximum:
20.396
jan 1, 2002
At the date of observation
Value
Absolute change
Change from previous value
jan 1, 1977
20.0
+20.0
0.0%
jan 1, 1978
19.943
-0.057
-0.29%
jan 1, 1979
17.195
-2.748
-13.78%
jan 1, 1980
17.314
+0.118
0.69%
jan 1, 1981
17.434
+0.121
0.7%
jan 1, 1982
18.856
+1.421
8.15%
jan 1, 1983
19.023
+0.167
0.89%
jan 1, 1984
16.577
-2.446
-12.86%
jan 1, 1985
19.744
+3.167
19.11%
jan 1, 1986
17.829
-1.915
-9.7%
jan 1, 1987
18.833
+1.004
5.63%
jan 1, 1988
17.799
-1.034
-5.49%
jan 1, 1989
17.285
-0.514
-2.89%
jan 1, 1990
18.504
+1.218
7.05%
jan 1, 1991
18.566
+0.062
0.34%
jan 1, 1992
18.125
-0.441
-2.37%
jan 1, 1993
18.428
+0.303
1.67%
jan 1, 1994
18.711
+0.283
1.53%
jan 1, 1995
19.484
+0.773
4.13%
jan 1, 1996
18.775
-0.708
-3.64%
jan 1, 1997
18.849
+0.074
0.39%
jan 1, 1998
18.881
+0.032
0.17%
jan 1, 1999
19.475
+0.595
3.15%
jan 1, 2000
18.832
-0.643
-3.3%
jan 1, 2001
19.876
+1.043
5.54%
jan 1, 2002
20.396
+0.52
2.62%
jan 1, 2003
19.164
-1.233
-6.04%
jan 1, 2004
19.308
+0.145
0.76%
jan 1, 2005
17.613
-1.695
-8.78%
jan 1, 2006
17.259
-0.355
-2.01%
jan 1, 2007
17.692
+0.433
2.51%
jan 1, 2008
18.16
+0.468
2.64%
jan 1, 2009
17.476
-0.684
-3.77%
jan 1, 2010
17.192
-0.283
-1.62%
jan 1, 2011
16.382
-0.811
-4.72%
jan 1, 2012
16.245
-0.137
-0.84%
jan 1, 2013
15.89
-0.355
-2.19%
jan 1, 2014
16.502
+0.612
3.85%
jan 1, 2015
16.253
-0.248
-1.5%
Ranking of countries by current statistics by years


Comments: