29
/
en
AIzaSyAYiBZKx7MnpbEhh9jyipgxe19OcubqV5w
April 1, 2024
141514
Greece
GRC
true
2
1
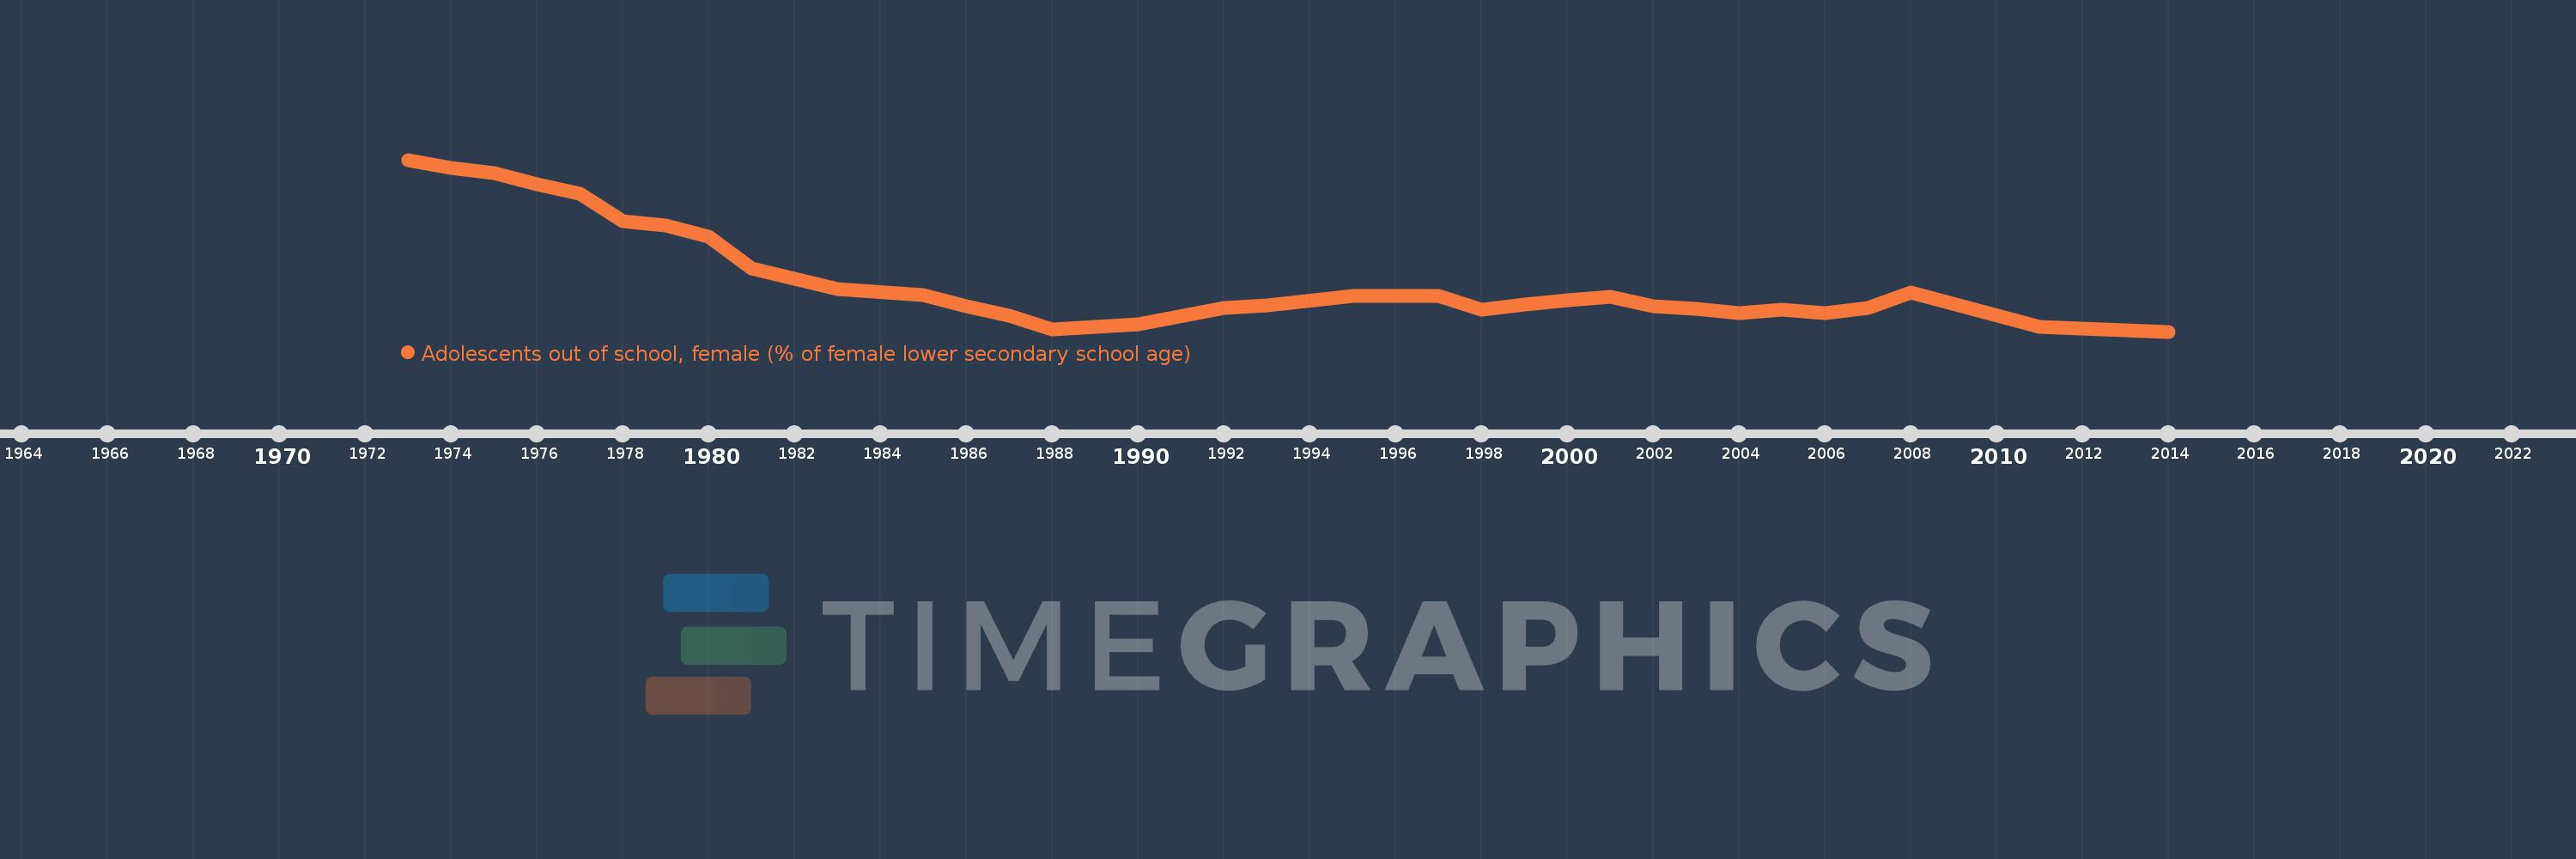
Adolescents out of school, female (% of female lower secondary school age)
2014,2011,2008,2007,2006,2005,2004,2003,2002,2001,2000,1999,1998,1997,1995,1993,1992,1990,1989,1988,1987,1986,1985,1983,1981,1980,1979,1978,1977,1976,1975,1974,1973
This statistics in other country:
AfghanistanAlbaniaAlgeriaAngolaAntigua and BarbudaArab WorldArgentinaArmeniaArubaAustraliaAzerbaijanBahamas, TheBahrainBangladeshBarbadosBelarusBelgiumBelizeBeninBermudaBhutanBoliviaBotswanaBrazilBrunei DarussalamBulgariaBurkina FasoBurundiCabo VerdeCambodiaCameroonCanadaCaribbean small statesCentral African RepublicCentral Europe and the BalticsChadChileColombiaComorosCongo, Dem. Rep.Congo, Rep.Costa RicaCroatiaCubaCyprusDenmarkDjiboutiDominicaDominican RepublicEarly-demographic dividendEast Asia & PacificEast Asia & Pacific (excluding high income)East Asia & Pacific (IDA & IBRD countries)EcuadorEgypt, Arab Rep.El SalvadorEritreaEstoniaEthiopiaEuro areaEurope & Central AsiaEurope & Central Asia (excluding high income)Europe & Central Asia (IDA & IBRD countries)European UnionFijiFinlandFragile and conflict affected situationsFranceGambia, TheGeorgiaGhanaGreeceGrenadaGuatemalaGuineaGuinea-BissauGuyanaHeavily indebted poor countries (HIPC)High incomeHondurasHong Kong SAR, ChinaHungaryIBRD onlyIcelandIDA & IBRD totalIDA blendIDA onlyIDA totalIndiaIndonesiaIran, Islamic Rep.IraqIrelandItalyJamaicaJordanKazakhstanKenyaKiribatiKorea, Rep.KuwaitKyrgyz RepublicLao PDRLate-demographic dividendLatin America & Caribbean Latin America & Caribbean (excluding high income)Latin America & the Caribbean (IDA & IBRD countries)LatviaLeast developed countries: UN classificationLebanonLesothoLibyaLiechtensteinLithuaniaLow & middle incomeLow incomeLower middle incomeLuxembourgMacao SAR, ChinaMacedonia, FYRMadagascarMalawiMaldivesMaliMaltaMauritaniaMauritiusMexicoMiddle East & North AfricaMiddle East & North Africa (excluding high income)Middle East & North Africa (IDA & IBRD countries)Middle incomeMoldovaMongoliaMoroccoMozambiqueMyanmarNamibiaNauruNetherlandsNew ZealandNicaraguaNigerNorth AmericaNorwayOECD membersOmanOther small statesPacific island small statesPakistanPanamaParaguayPeruPhilippinesPolandPortugalPost-demographic dividendPre-demographic dividendPuerto RicoQatarRomaniaRussian FederationSamoaSao Tome and PrincipeSaudi ArabiaSenegalSerbiaSeychellesSierra LeoneSloveniaSmall statesSolomon IslandsSomaliaSouth AfricaSouth AsiaSouth Asia (IDA & IBRD)SpainSri LankaSt. Kitts and NevisSt. LuciaSt. Vincent and the GrenadinesSub-Saharan Africa Sub-Saharan Africa (excluding high income)Sub-Saharan Africa (IDA & IBRD countries)SudanSurinameSwazilandSwedenSwitzerlandSyrian Arab RepublicTajikistanThailandTimor-LesteTogoTongaTrinidad and TobagoTunisiaTurkeyTuvaluUgandaUkraineUnited Arab EmiratesUnited KingdomUnited StatesUpper middle incomeUruguayVanuatuVenezuela, RBWest Bank and GazaWorldYemen, Rep.Zimbabwe Timeline:
This timeline shows a graph from 1973 to 2014 of Greece. No data until 1972. Number of actual observations by date: 33.
Source name:
World Development Indicators
Source organization:
United Nations Educational, Scientific, and Cultural Organization (UNESCO) Institute for Statistics.
Categories, topics:
Education
Last updated:
apr 23, 2017
Indicators value changes by year
Maximum:
35.082
jan 1, 1973
At the date of observation
Value
Absolute change
Change from previous value
jan 1, 1973
35.082
+35.082
0.0%
jan 1, 1974
33.52
-1.562
-4.45%
jan 1, 1975
32.545
-0.975
-2.91%
jan 1, 1976
30.403
-2.142
-6.58%
jan 1, 1977
28.49
-1.913
-6.29%
jan 1, 1978
23.217
-5.273
-18.51%
jan 1, 1979
22.331
-0.886
-3.82%
jan 1, 1980
20.251
-2.08
-9.32%
jan 1, 1981
14.105
-6.146
-30.35%
jan 1, 1983
9.949
-4.156
-29.47%
jan 1, 1985
8.796
-1.153
-11.59%
jan 1, 1986
6.671
-2.125
-24.16%
jan 1, 1987
4.947
-1.724
-25.84%
jan 1, 1988
2.246
-2.701
-54.6%
jan 1, 1989
2.694
+0.449
19.97%
jan 1, 1990
3.224
+0.53
19.66%
jan 1, 1992
6.374
+3.15
97.71%
jan 1, 1993
6.866
+0.492
7.72%
jan 1, 1995
8.733
+1.867
27.19%
jan 1, 1997
8.727
-0.006
-0.07%
jan 1, 1998
5.993
-2.734
-31.33%
jan 1, 1999
6.96
+0.967
16.13%
jan 1, 2000
7.889
+0.929
13.35%
jan 1, 2001
8.564
+0.676
8.57%
jan 1, 2002
6.78
-1.784
-20.83%
jan 1, 2003
6.206
-0.575
-8.47%
jan 1, 2004
5.292
-0.913
-14.72%
jan 1, 2005
6.11
+0.818
15.45%
jan 1, 2006
5.293
-0.817
-13.37%
jan 1, 2007
6.329
+1.037
19.59%
jan 1, 2008
9.385
+3.056
48.28%
jan 1, 2011
2.718
-6.667
-71.04%
jan 1, 2014
1.789
-0.929
-34.19%
Ranking of countries by current statistics by years


Comments: