29
/
en
AIzaSyAYiBZKx7MnpbEhh9jyipgxe19OcubqV5w
April 1, 2024
181818
Luxembourg
LUX
true
2
1
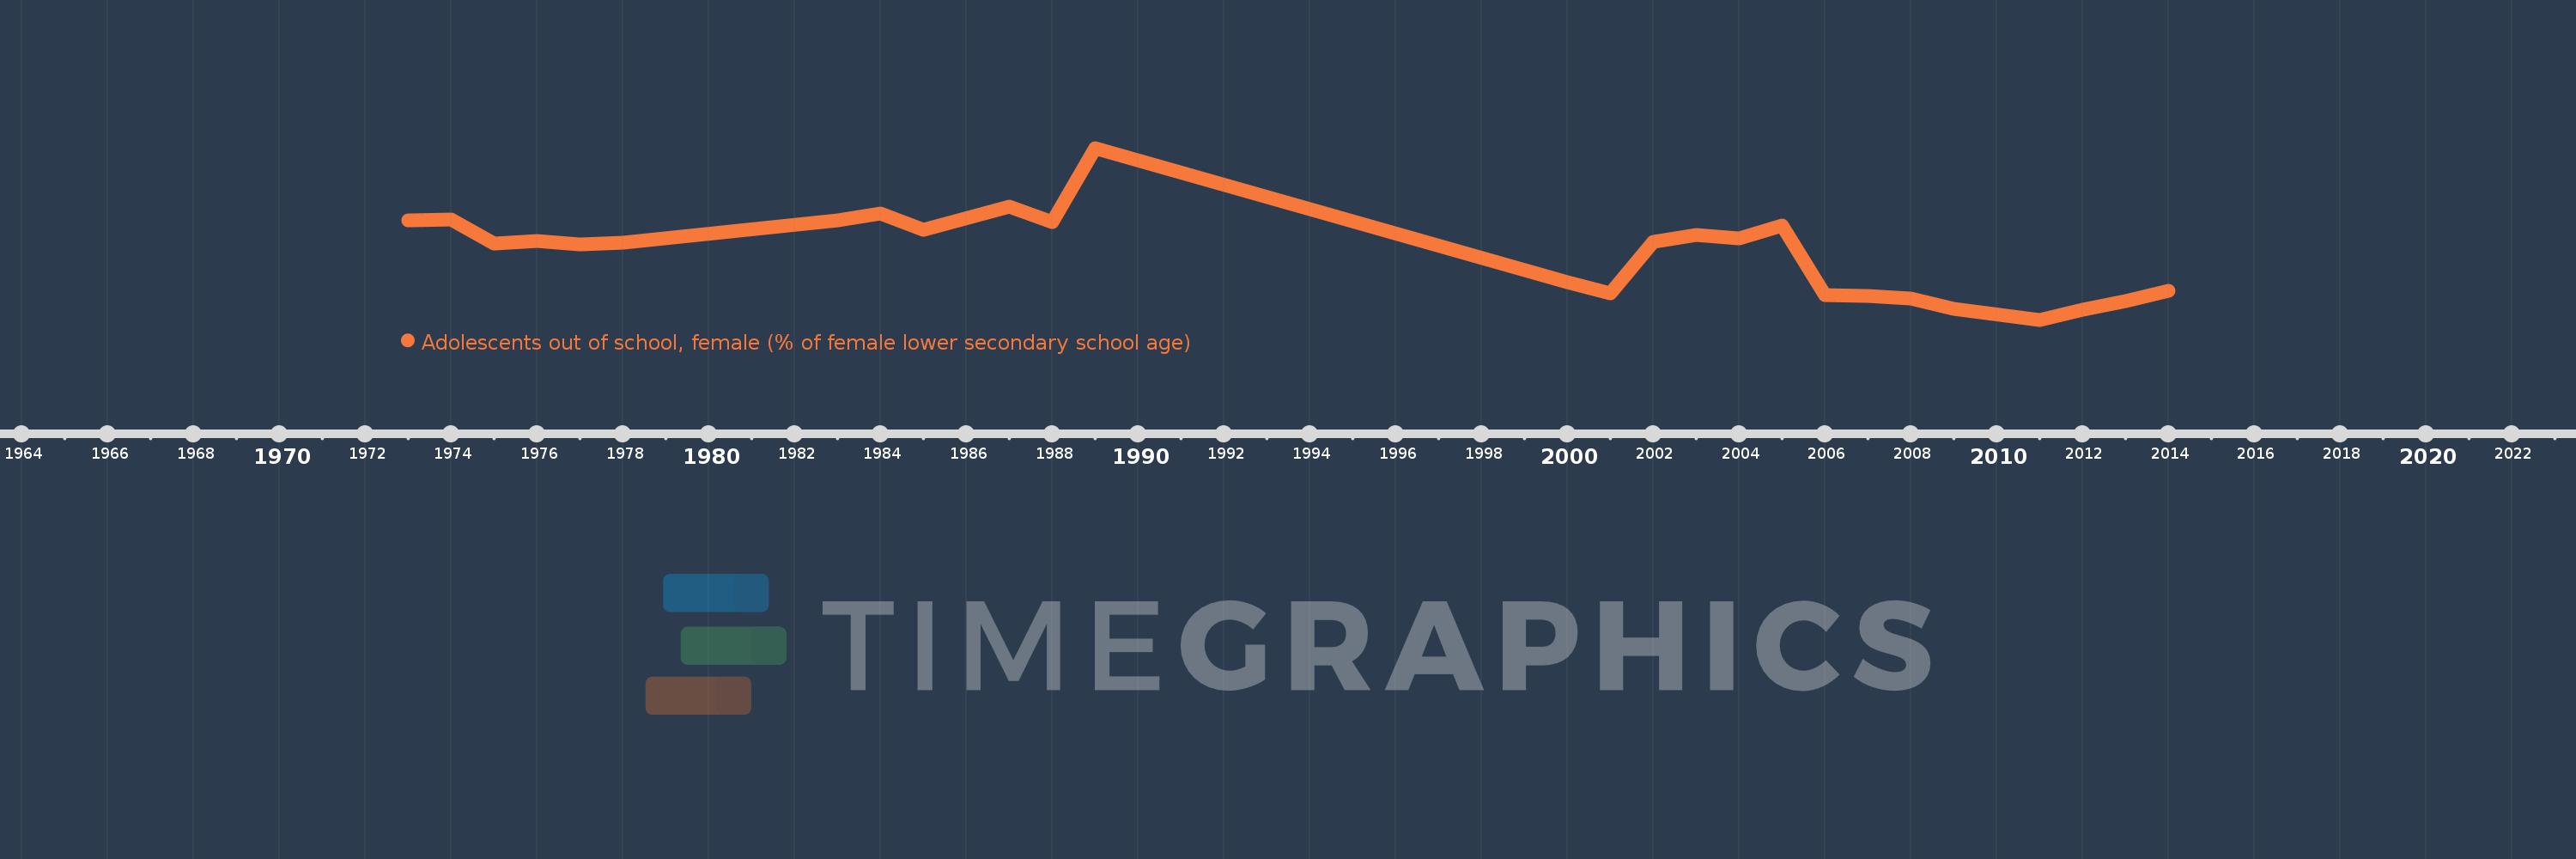
Adolescents out of school, female (% of female lower secondary school age)
2014,2013,2012,2011,2009,2008,2007,2006,2005,2004,2003,2002,2001,2000,1989,1988,1987,1985,1984,1983,1978,1977,1976,1975,1974,1973
This statistics in other country:
AfghanistanAlbaniaAlgeriaAngolaAntigua and BarbudaArab WorldArgentinaArmeniaArubaAustraliaAzerbaijanBahamas, TheBahrainBangladeshBarbadosBelarusBelgiumBelizeBeninBermudaBhutanBoliviaBotswanaBrazilBrunei DarussalamBulgariaBurkina FasoBurundiCabo VerdeCambodiaCameroonCanadaCaribbean small statesCentral African RepublicCentral Europe and the BalticsChadChileColombiaComorosCongo, Dem. Rep.Congo, Rep.Costa RicaCroatiaCubaCyprusDenmarkDjiboutiDominicaDominican RepublicEarly-demographic dividendEast Asia & PacificEast Asia & Pacific (excluding high income)East Asia & Pacific (IDA & IBRD countries)EcuadorEgypt, Arab Rep.El SalvadorEritreaEstoniaEthiopiaEuro areaEurope & Central AsiaEurope & Central Asia (excluding high income)Europe & Central Asia (IDA & IBRD countries)European UnionFijiFinlandFragile and conflict affected situationsFranceGambia, TheGeorgiaGhanaGreeceGrenadaGuatemalaGuineaGuinea-BissauGuyanaHeavily indebted poor countries (HIPC)High incomeHondurasHong Kong SAR, ChinaHungaryIBRD onlyIcelandIDA & IBRD totalIDA blendIDA onlyIDA totalIndiaIndonesiaIran, Islamic Rep.IraqIrelandItalyJamaicaJordanKazakhstanKenyaKiribatiKorea, Rep.KuwaitKyrgyz RepublicLao PDRLate-demographic dividendLatin America & Caribbean Latin America & Caribbean (excluding high income)Latin America & the Caribbean (IDA & IBRD countries)LatviaLeast developed countries: UN classificationLebanonLesothoLibyaLiechtensteinLithuaniaLow & middle incomeLow incomeLower middle incomeLuxembourgMacao SAR, ChinaMacedonia, FYRMadagascarMalawiMaldivesMaliMaltaMauritaniaMauritiusMexicoMiddle East & North AfricaMiddle East & North Africa (excluding high income)Middle East & North Africa (IDA & IBRD countries)Middle incomeMoldovaMongoliaMoroccoMozambiqueMyanmarNamibiaNauruNetherlandsNew ZealandNicaraguaNigerNorth AmericaNorwayOECD membersOmanOther small statesPacific island small statesPakistanPanamaParaguayPeruPhilippinesPolandPortugalPost-demographic dividendPre-demographic dividendPuerto RicoQatarRomaniaRussian FederationSamoaSao Tome and PrincipeSaudi ArabiaSenegalSerbiaSeychellesSierra LeoneSloveniaSmall statesSolomon IslandsSomaliaSouth AfricaSouth AsiaSouth Asia (IDA & IBRD)SpainSri LankaSt. Kitts and NevisSt. LuciaSt. Vincent and the GrenadinesSub-Saharan Africa Sub-Saharan Africa (excluding high income)Sub-Saharan Africa (IDA & IBRD countries)SudanSurinameSwazilandSwedenSwitzerlandSyrian Arab RepublicTajikistanThailandTimor-LesteTogoTongaTrinidad and TobagoTunisiaTurkeyTuvaluUgandaUkraineUnited Arab EmiratesUnited KingdomUnited StatesUpper middle incomeUruguayVanuatuVenezuela, RBWest Bank and GazaWorldYemen, Rep.Zimbabwe Timeline:
This timeline shows a graph from 1973 to 2014 of Luxembourg. No data until 1972. Number of actual observations by date: 26.
Source name:
World Development Indicators
Source organization:
United Nations Educational, Scientific, and Cultural Organization (UNESCO) Institute for Statistics.
Categories, topics:
Education
Last updated:
apr 23, 2017
Indicators value changes by year
Maximum:
24.819
jan 1, 1989
At the date of observation
Value
Absolute change
Change from previous value
jan 1, 1973
14.484
+14.484
0.0%
jan 1, 1974
14.709
+0.225
1.56%
jan 1, 1975
11.282
-3.427
-23.3%
jan 1, 1976
11.591
+0.309
2.74%
jan 1, 1977
11.078
-0.514
-4.43%
jan 1, 1978
11.395
+0.318
2.87%
jan 1, 1983
14.546
+3.151
27.65%
jan 1, 1984
15.465
+0.919
6.32%
jan 1, 1985
13.182
-2.282
-14.76%
jan 1, 1987
16.526
+3.343
25.36%
jan 1, 1988
14.33
-2.196
-13.29%
jan 1, 1989
24.819
+10.49
73.21%
jan 1, 2000
5.776
-19.043
-76.73%
jan 1, 2001
4.134
-1.642
-28.43%
jan 1, 2002
11.469
+7.335
177.44%
jan 1, 2003
12.49
+1.021
8.9%
jan 1, 2004
11.946
-0.544
-4.36%
jan 1, 2005
13.815
+1.869
15.64%
jan 1, 2006
3.89
-9.925
-71.84%
jan 1, 2007
3.835
-0.055
-1.41%
jan 1, 2008
3.406
-0.429
-11.2%
jan 1, 2009
1.928
-1.477
-43.37%
jan 1, 2011
0.428
-1.5
-77.8%
jan 1, 2012
1.87
+1.442
336.81%
jan 1, 2013
3.059
+1.189
63.58%
jan 1, 2014
4.511
+1.452
47.46%
Ranking of countries by current statistics by years


Comments: