29
/
en
AIzaSyAYiBZKx7MnpbEhh9jyipgxe19OcubqV5w
April 1, 2024
241592
Slovak Republic
SVK
true
2
1
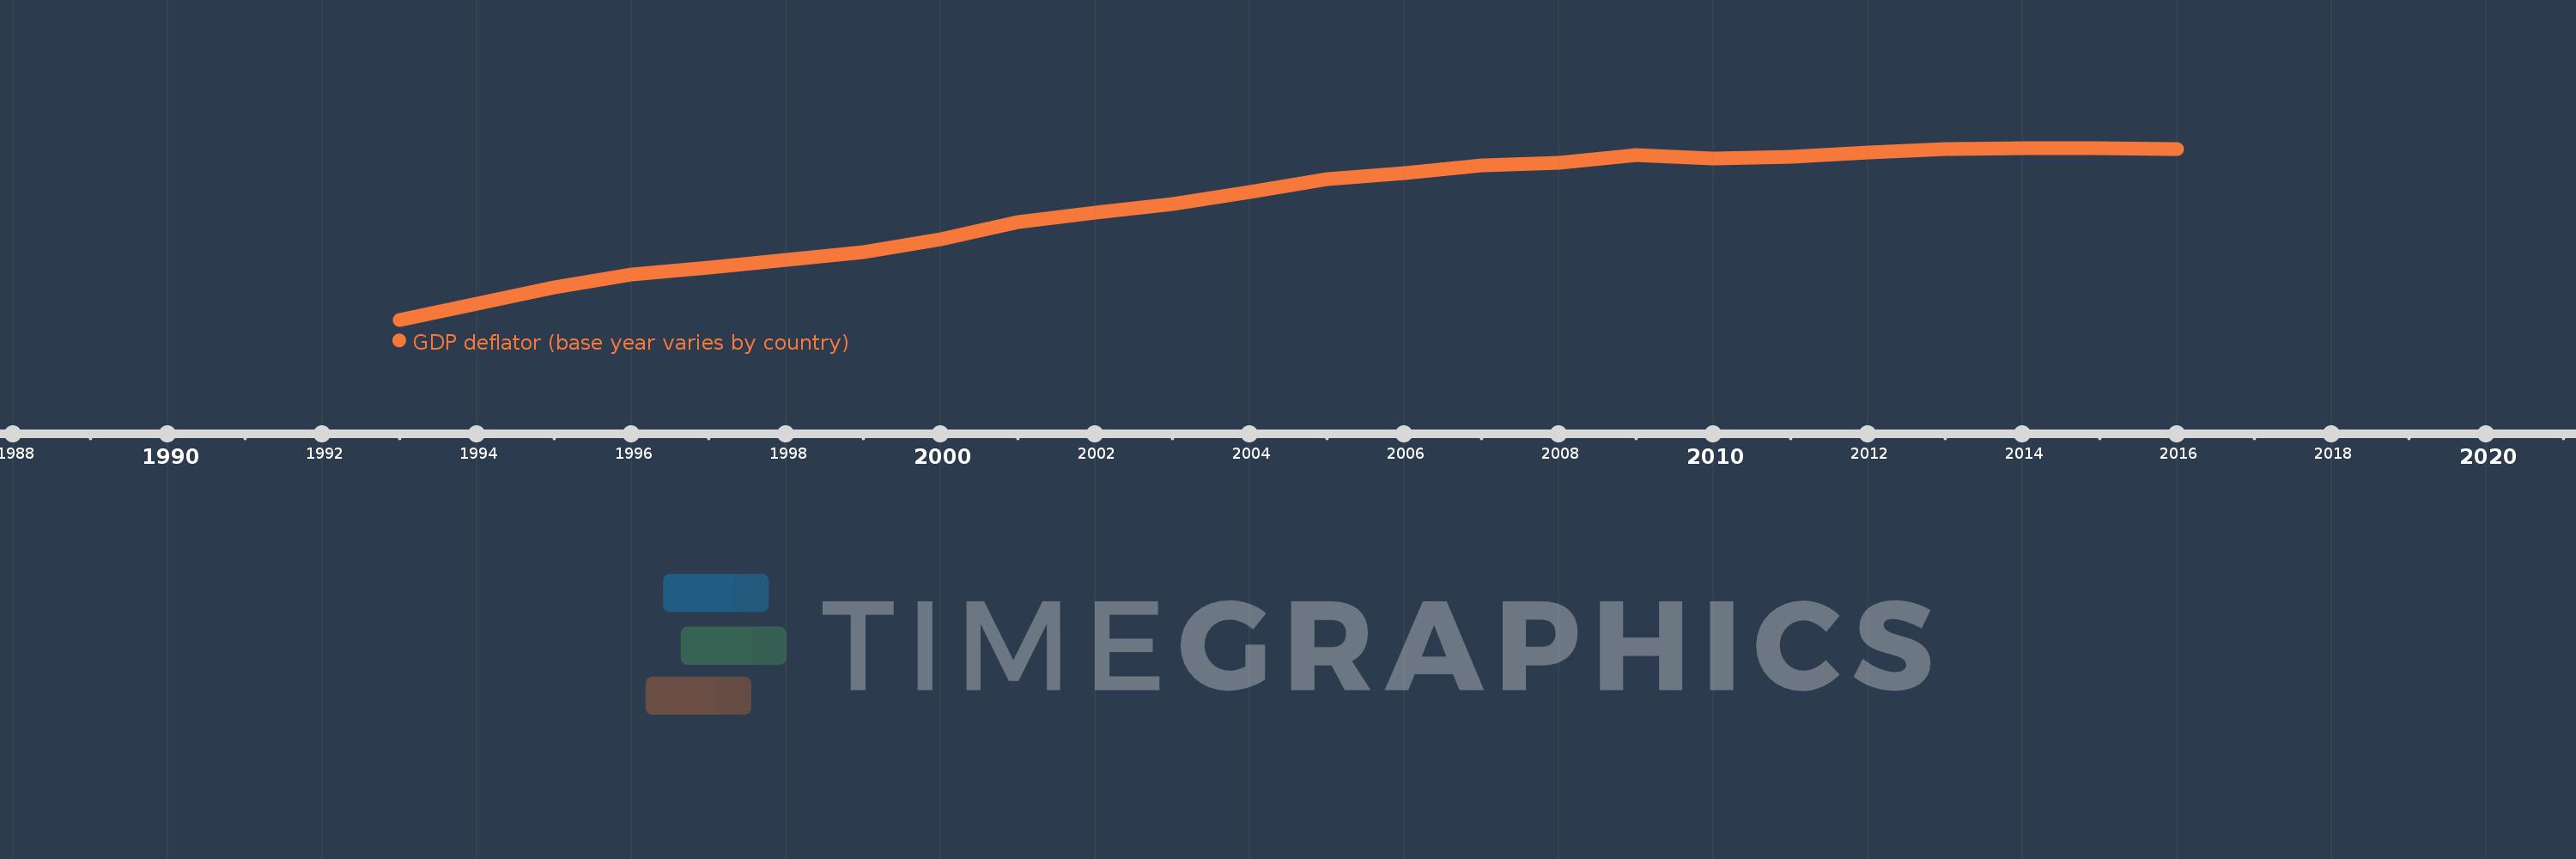
GDP deflator (base year varies by country)
2016,2015,2014,2013,2012,2011,2010,2009,2008,2007,2006,2005,2004,2003,2002,2001,2000,1999,1998,1997,1996,1995,1994,1993
This statistics in other country:
AfghanistanAlbaniaAlgeriaAndorraAngolaAntigua and BarbudaArgentinaArmeniaArubaAustraliaAustriaAzerbaijanBahamas, TheBahrainBangladeshBarbadosBelarusBelgiumBelizeBeninBermudaBhutanBoliviaBosnia and HerzegovinaBotswanaBrazilBrunei DarussalamBulgariaBurkina FasoBurundiCabo VerdeCambodiaCameroonCanadaCayman IslandsCentral African RepublicChadChannel IslandsChileChinaColombiaComorosCongo, Dem. Rep.Congo, Rep.Costa RicaCote d'IvoireCroatiaCubaCyprusCzech RepublicDenmarkDjiboutiDominicaDominican RepublicEcuadorEgypt, Arab Rep.El SalvadorEquatorial GuineaEritreaEstoniaEthiopiaFijiFinlandFranceFrench PolynesiaGabonGambia, TheGeorgiaGermanyGhanaGreeceGreenlandGrenadaGuatemalaGuineaGuinea-BissauGuyanaHaitiHondurasHong Kong SAR, ChinaHungaryIcelandIndiaIndonesiaIran, Islamic Rep.IraqIrelandIsle of ManIsraelItalyJamaicaJapanJordanKazakhstanKenyaKiribatiKorea, Rep.KosovoKuwaitKyrgyz RepublicLao PDRLatviaLebanonLesothoLiberiaLibyaLiechtensteinLithuaniaLuxembourgMacao SAR, ChinaMacedonia, FYRMadagascarMalawiMalaysiaMaldivesMaliMaltaMarshall IslandsMauritaniaMauritiusMexicoMicronesia, Fed. Sts.MoldovaMonacoMongoliaMontenegroMoroccoMozambiqueMyanmarNamibiaNauruNepalNetherlandsNew CaledoniaNew ZealandNicaraguaNigerNigeriaNorwayOmanPakistanPalauPanamaPapua New GuineaParaguayPeruPhilippinesPolandPortugalPuerto RicoQatarRomaniaRussian FederationRwandaSamoaSan MarinoSao Tome and PrincipeSaudi ArabiaSenegalSerbiaSeychellesSierra LeoneSingaporeSlovak RepublicSloveniaSolomon IslandsSomaliaSouth AfricaSouth SudanSpainSri LankaSt. Kitts and NevisSt. LuciaSt. Vincent and the GrenadinesSudanSurinameSwazilandSwedenSwitzerlandSyrian Arab RepublicTajikistanTanzaniaThailandTimor-LesteTogoTongaTrinidad and TobagoTunisiaTurkeyTurkmenistanTuvaluUgandaUkraineUnited Arab EmiratesUnited KingdomUnited StatesUruguayUzbekistanVanuatuVenezuela, RBVietnamVirgin Islands (U.S.)West Bank and GazaYemen, Rep.ZambiaZimbabwe Timeline:
This timeline shows a graph from 1993 to 2016 of Slovak Republic. No data until 1992. Number of actual observations by date: 24.
Source name:
World Development Indicators
Source organization:
World Bank national accounts data, and OECD National Accounts data files.
Categories, topics:
Economy & Growth
Last updated:
apr 23, 2017
Indicators value changes by year
Minimum:
38.793
jan 1, 1993
Maximum:
103.464
jan 1, 2014
At the date of observation
Value
Absolute change
Change from previous value
jan 1, 1993
38.793
+38.793
0.0%
jan 1, 1994
44.836
+6.043
15.58%
jan 1, 1995
50.866
+6.03
13.45%
jan 1, 1996
55.897
+5.031
9.89%
jan 1, 1997
58.385
+2.488
4.45%
jan 1, 1998
61.225
+2.839
4.86%
jan 1, 1999
64.284
+3.059
5.0%
jan 1, 2000
68.966
+4.682
7.28%
jan 1, 2001
75.431
+6.464
9.37%
jan 1, 2002
79.269
+3.838
5.09%
jan 1, 2003
82.402
+3.133
3.95%
jan 1, 2004
86.814
+4.412
5.35%
jan 1, 2005
91.834
+5.019
5.78%
jan 1, 2006
94.075
+2.242
2.44%
jan 1, 2007
96.821
+2.746
2.92%
jan 1, 2008
97.914
+1.093
1.13%
jan 1, 2009
100.69
+2.775
2.83%
jan 1, 2010
99.517
-1.173
-1.16%
jan 1, 2011
100.0
+0.483
0.49%
jan 1, 2012
101.648
+1.648
1.65%
jan 1, 2013
102.93
+1.283
1.26%
jan 1, 2014
103.464
+0.534
0.52%
jan 1, 2015
103.287
-0.177
-0.17%
jan 1, 2016
103.064
-0.223
-0.22%
Ranking of countries by current statistics by years


Comments: