29
/
en
AIzaSyAYiBZKx7MnpbEhh9jyipgxe19OcubqV5w
April 1, 2024
195545
Mexico
MEX
true
2
1
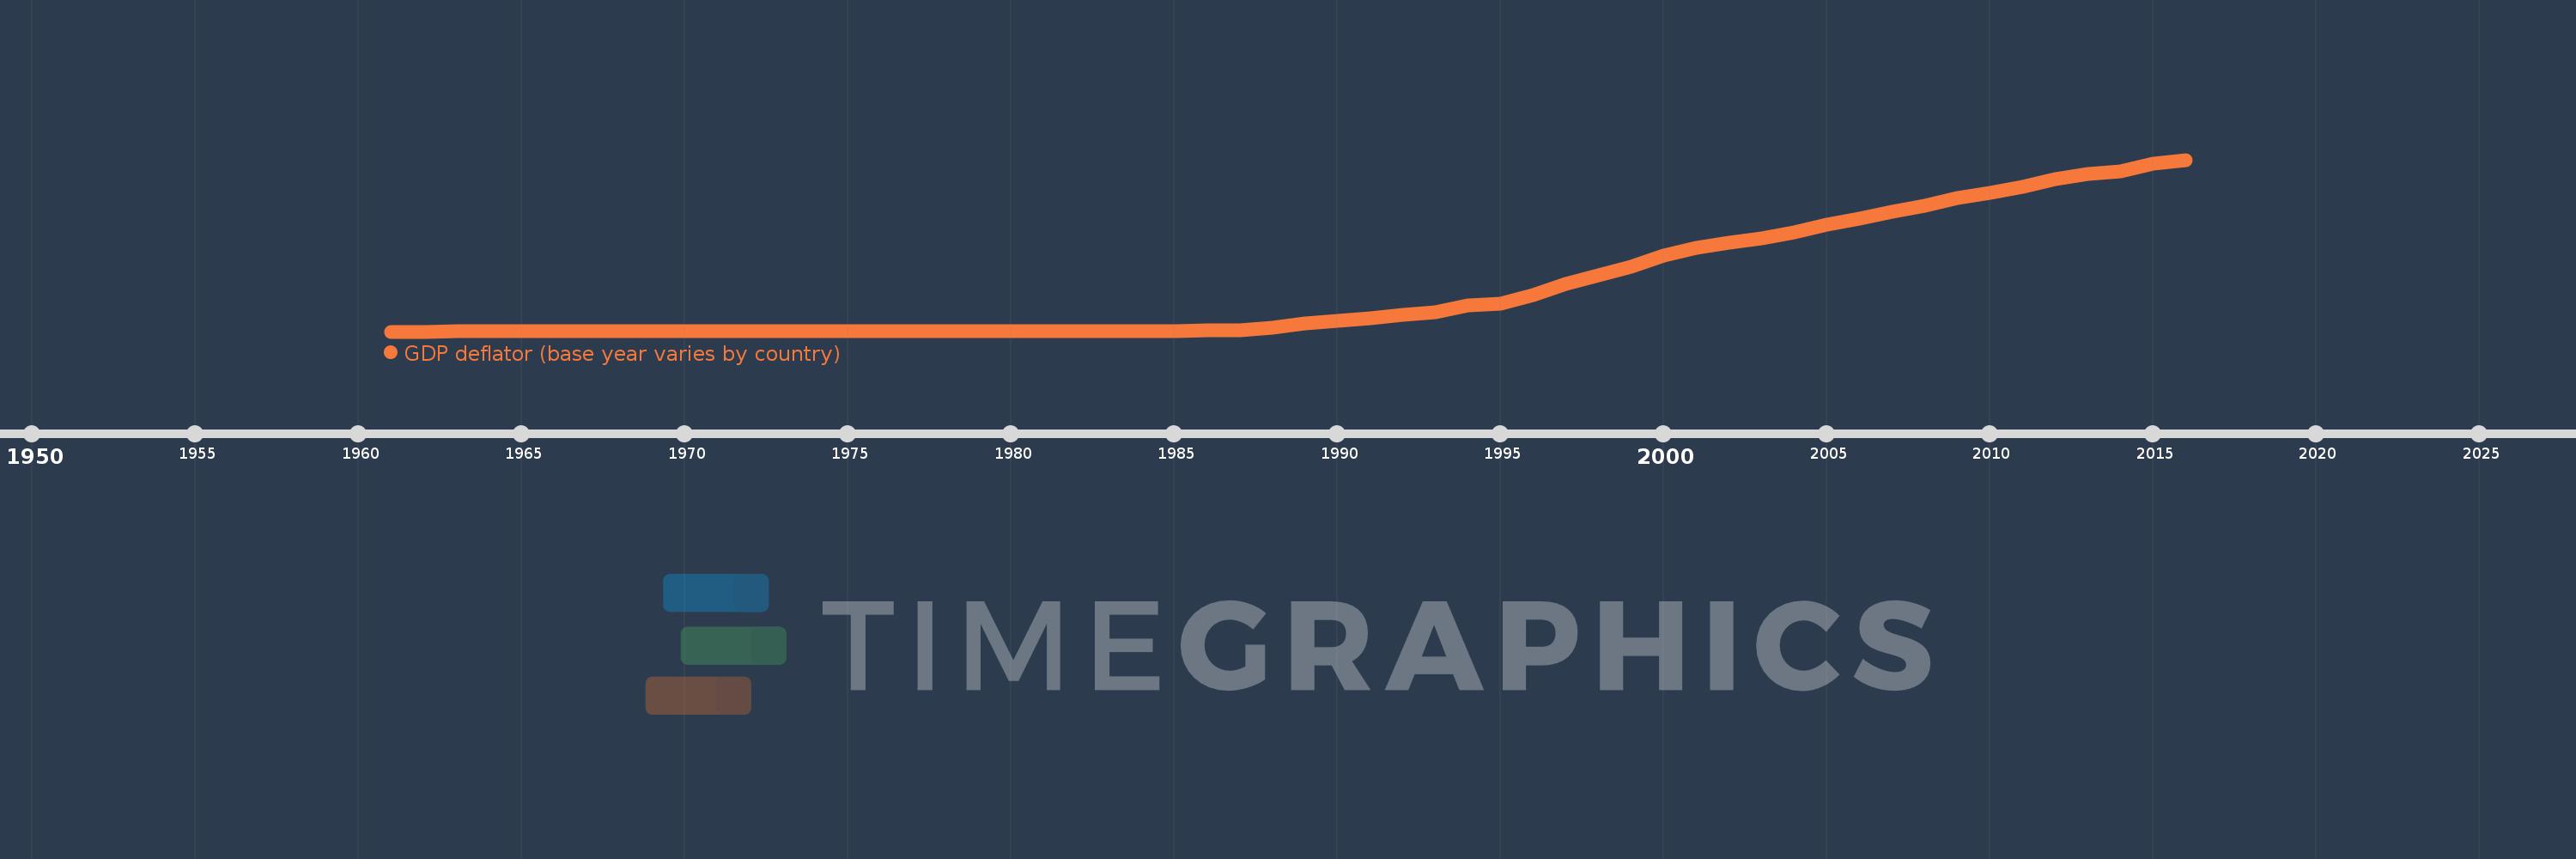
GDP deflator (base year varies by country)
2016,2015,2014,2013,2012,2011,2010,2009,2008,2007,2006,2005,2004,2003,2002,2001,2000,1999,1998,1997,1996,1995,1994,1993,1992,1991,1990,1989,1988,1987,1986,1985,1984,1983,1982,1981,1980,1979,1978,1977,1976,1975,1974,1973,1972,1971,1970,1969,1968,1967,1966,1965,1964,1963,1962,1961
This statistics in other country:
AfghanistanAlbaniaAlgeriaAndorraAngolaAntigua and BarbudaArgentinaArmeniaArubaAustraliaAustriaAzerbaijanBahamas, TheBahrainBangladeshBarbadosBelarusBelgiumBelizeBeninBermudaBhutanBoliviaBosnia and HerzegovinaBotswanaBrazilBrunei DarussalamBulgariaBurkina FasoBurundiCabo VerdeCambodiaCameroonCanadaCayman IslandsCentral African RepublicChadChannel IslandsChileChinaColombiaComorosCongo, Dem. Rep.Congo, Rep.Costa RicaCote d'IvoireCroatiaCubaCyprusCzech RepublicDenmarkDjiboutiDominicaDominican RepublicEcuadorEgypt, Arab Rep.El SalvadorEquatorial GuineaEritreaEstoniaEthiopiaFijiFinlandFranceFrench PolynesiaGabonGambia, TheGeorgiaGermanyGhanaGreeceGreenlandGrenadaGuatemalaGuineaGuinea-BissauGuyanaHaitiHondurasHong Kong SAR, ChinaHungaryIcelandIndiaIndonesiaIran, Islamic Rep.IraqIrelandIsle of ManIsraelItalyJamaicaJapanJordanKazakhstanKenyaKiribatiKorea, Rep.KosovoKuwaitKyrgyz RepublicLao PDRLatviaLebanonLesothoLiberiaLibyaLiechtensteinLithuaniaLuxembourgMacao SAR, ChinaMacedonia, FYRMadagascarMalawiMalaysiaMaldivesMaliMaltaMarshall IslandsMauritaniaMauritiusMexicoMicronesia, Fed. Sts.MoldovaMonacoMongoliaMontenegroMoroccoMozambiqueMyanmarNamibiaNauruNepalNetherlandsNew CaledoniaNew ZealandNicaraguaNigerNigeriaNorwayOmanPakistanPalauPanamaPapua New GuineaParaguayPeruPhilippinesPolandPortugalPuerto RicoQatarRomaniaRussian FederationRwandaSamoaSan MarinoSao Tome and PrincipeSaudi ArabiaSenegalSerbiaSeychellesSierra LeoneSingaporeSlovak RepublicSloveniaSolomon IslandsSomaliaSouth AfricaSouth SudanSpainSri LankaSt. Kitts and NevisSt. LuciaSt. Vincent and the GrenadinesSudanSurinameSwazilandSwedenSwitzerlandSyrian Arab RepublicTajikistanTanzaniaThailandTimor-LesteTogoTongaTrinidad and TobagoTunisiaTurkeyTurkmenistanTuvaluUgandaUkraineUnited Arab EmiratesUnited KingdomUnited StatesUruguayUzbekistanVanuatuVenezuela, RBVietnamVirgin Islands (U.S.)West Bank and GazaYemen, Rep.ZambiaZimbabwe Timeline:
This timeline shows a graph from 1961 to 2016 of Mexico. No data until 1960. Number of actual observations by date: 56.
Source name:
World Development Indicators
Source organization:
World Bank national accounts data, and OECD National Accounts data files.
Categories, topics:
Economy & Growth
Last updated:
apr 23, 2017
Indicators value changes by year
Maximum:
128.47
jan 1, 2016
At the date of observation
Value
Absolute change
Change from previous value
jan 1, 1961
0.01
+0.01
0.0%
jan 1, 1962
0.01
+0.0
3.25%
jan 1, 1963
0.011
+0.0
2.75%
jan 1, 1964
0.011
+0.0
2.93%
jan 1, 1965
0.011
+0.001
5.9%
jan 1, 1966
0.012
+0.0
1.56%
jan 1, 1967
0.012
+0.001
5.08%
jan 1, 1968
0.013
+0.0
3.08%
jan 1, 1969
0.013
+0.0
1.05%
jan 1, 1970
0.014
+0.001
7.07%
jan 1, 1971
0.014
+0.0
2.63%
jan 1, 1972
0.015
+0.001
6.3%
jan 1, 1973
0.016
+0.001
6.49%
jan 1, 1974
0.018
+0.002
13.42%
jan 1, 1975
0.022
+0.004
23.11%
jan 1, 1976
0.026
+0.003
15.63%
jan 1, 1977
0.031
+0.005
19.36%
jan 1, 1978
0.04
+0.009
30.46%
jan 1, 1979
0.046
+0.006
16.01%
jan 1, 1980
0.055
+0.009
19.63%
jan 1, 1981
0.074
+0.019
33.41%
jan 1, 1982
0.093
+0.019
26.01%
jan 1, 1983
0.15
+0.057
60.92%
jan 1, 1984
0.285
+0.136
90.47%
jan 1, 1985
0.454
+0.169
59.09%
jan 1, 1986
0.712
+0.258
56.74%
jan 1, 1987
1.236
+0.524
73.62%
jan 1, 1988
2.961
+1.726
139.66%
jan 1, 1989
6.298
+3.337
112.71%
jan 1, 1990
7.969
+1.671
26.53%
jan 1, 1991
10.211
+2.242
28.13%
jan 1, 1992
12.585
+2.374
23.25%
jan 1, 1993
14.399
+1.814
14.41%
jan 1, 1994
19.306
+4.907
34.08%
jan 1, 1995
20.896
+1.589
8.23%
jan 1, 1996
27.494
+6.599
31.58%
jan 1, 1997
35.536
+8.042
29.25%
jan 1, 1998
41.861
+6.325
17.8%
jan 1, 1999
48.188
+6.327
15.11%
jan 1, 2000
56.694
+8.506
17.65%
jan 1, 2001
62.827
+6.133
10.82%
jan 1, 2002
66.203
+3.376
5.37%
jan 1, 2003
69.926
+3.722
5.62%
jan 1, 2004
74.097
+4.172
5.97%
jan 1, 2005
80.255
+6.158
8.31%
jan 1, 2006
84.596
+4.341
5.41%
jan 1, 2007
89.827
+5.231
6.18%
jan 1, 2008
94.339
+4.512
5.02%
jan 1, 2009
100.0
+5.661
6.0%
jan 1, 2010
103.537
+3.537
3.54%
jan 1, 2011
108.181
+4.644
4.49%
jan 1, 2012
113.901
+5.72
5.29%
jan 1, 2013
117.606
+3.705
3.25%
jan 1, 2014
119.674
+2.068
1.76%
jan 1, 2015
125.31
+5.636
4.71%
jan 1, 2016
128.47
+3.16
2.52%
Ranking of countries by current statistics by years


Comments: