29
/
en
AIzaSyAYiBZKx7MnpbEhh9jyipgxe19OcubqV5w
April 1, 2024
76163
Bahamas, The
BHS
true
2
1
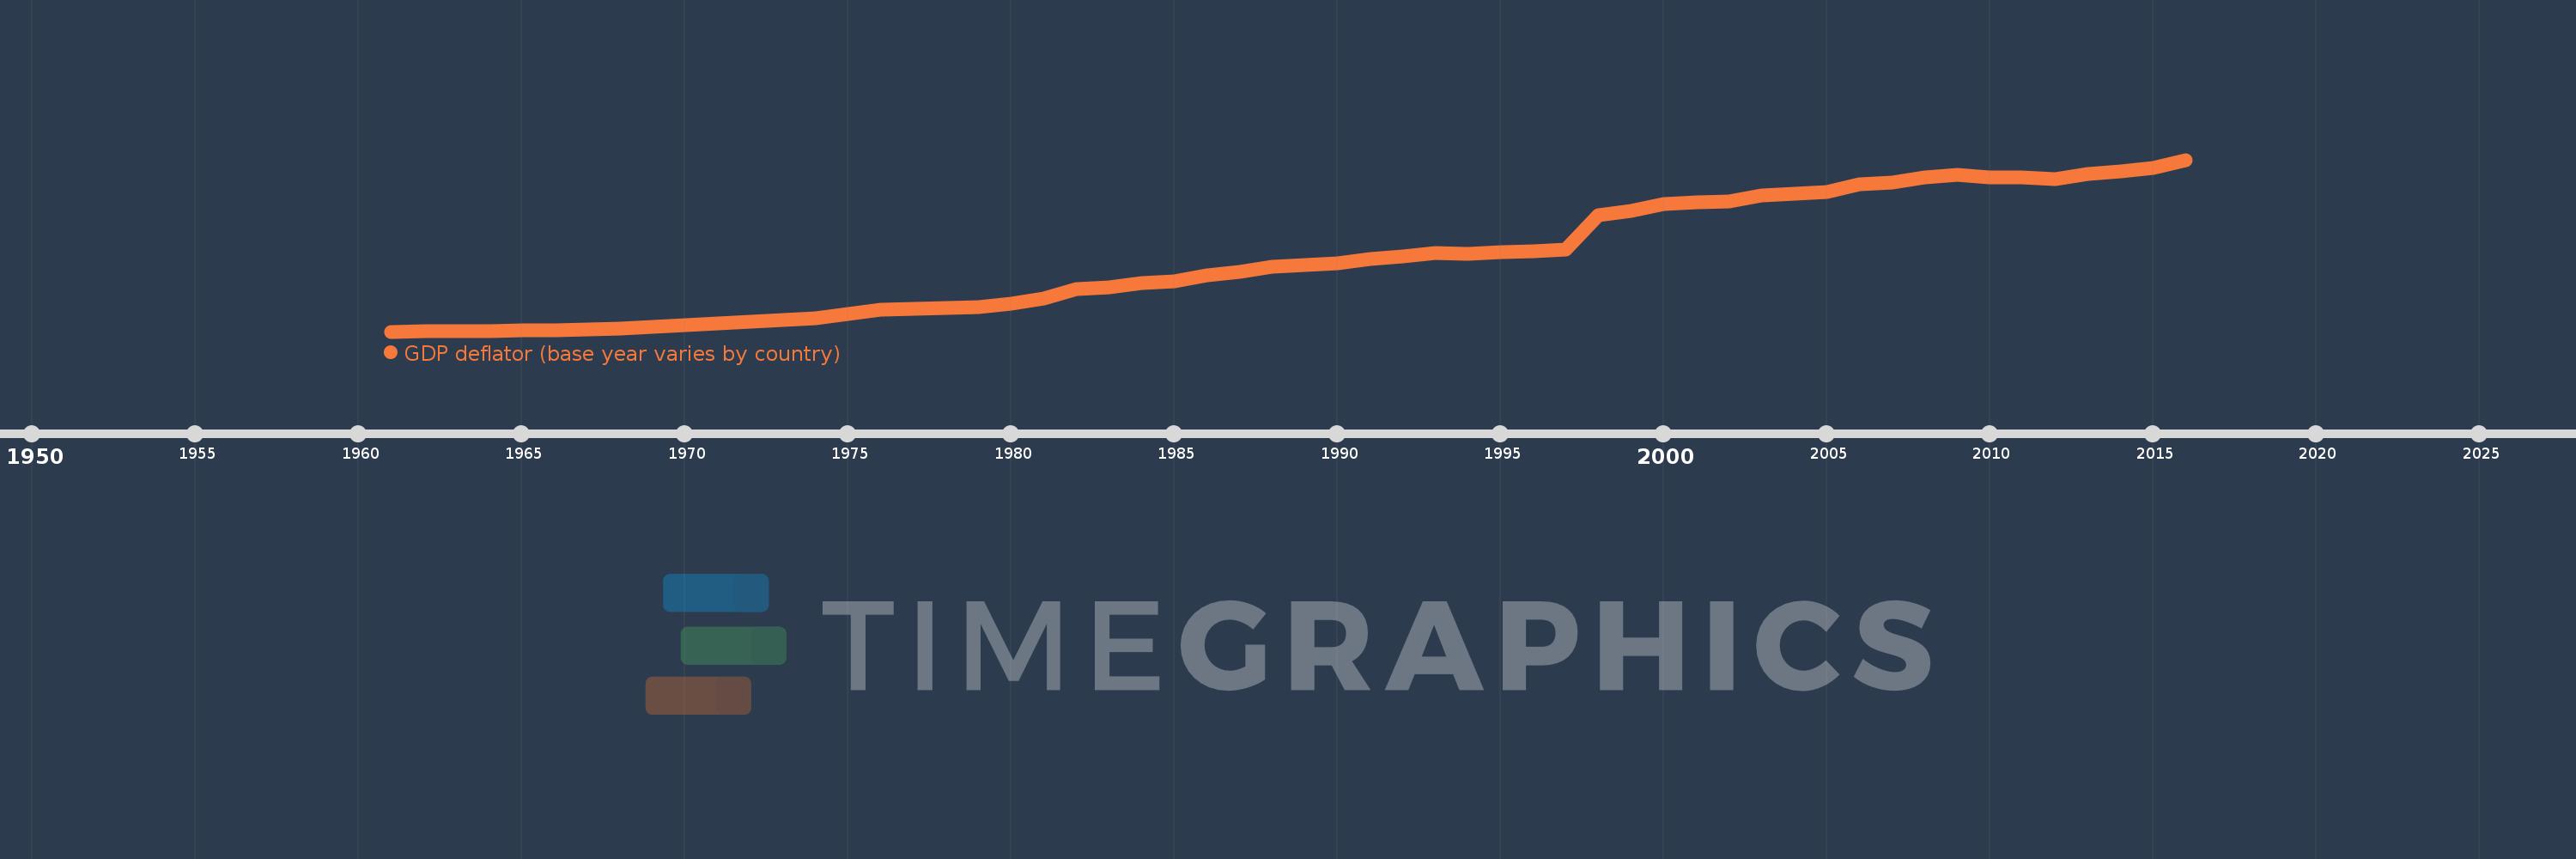
GDP deflator (base year varies by country)
2016,2015,2014,2013,2012,2011,2010,2009,2008,2007,2006,2005,2004,2003,2002,2001,2000,1999,1998,1997,1996,1995,1994,1993,1992,1991,1990,1989,1988,1987,1986,1985,1984,1983,1982,1981,1980,1979,1978,1977,1976,1975,1974,1973,1972,1971,1970,1969,1968,1967,1966,1965,1964,1963,1962,1961
This statistics in other country:
AfghanistanAlbaniaAlgeriaAndorraAngolaAntigua and BarbudaArgentinaArmeniaArubaAustraliaAustriaAzerbaijanBahamas, TheBahrainBangladeshBarbadosBelarusBelgiumBelizeBeninBermudaBhutanBoliviaBosnia and HerzegovinaBotswanaBrazilBrunei DarussalamBulgariaBurkina FasoBurundiCabo VerdeCambodiaCameroonCanadaCayman IslandsCentral African RepublicChadChannel IslandsChileChinaColombiaComorosCongo, Dem. Rep.Congo, Rep.Costa RicaCote d'IvoireCroatiaCubaCyprusCzech RepublicDenmarkDjiboutiDominicaDominican RepublicEcuadorEgypt, Arab Rep.El SalvadorEquatorial GuineaEritreaEstoniaEthiopiaFijiFinlandFranceFrench PolynesiaGabonGambia, TheGeorgiaGermanyGhanaGreeceGreenlandGrenadaGuatemalaGuineaGuinea-BissauGuyanaHaitiHondurasHong Kong SAR, ChinaHungaryIcelandIndiaIndonesiaIran, Islamic Rep.IraqIrelandIsle of ManIsraelItalyJamaicaJapanJordanKazakhstanKenyaKiribatiKorea, Rep.KosovoKuwaitKyrgyz RepublicLao PDRLatviaLebanonLesothoLiberiaLibyaLiechtensteinLithuaniaLuxembourgMacao SAR, ChinaMacedonia, FYRMadagascarMalawiMalaysiaMaldivesMaliMaltaMarshall IslandsMauritaniaMauritiusMexicoMicronesia, Fed. Sts.MoldovaMonacoMongoliaMontenegroMoroccoMozambiqueMyanmarNamibiaNauruNepalNetherlandsNew CaledoniaNew ZealandNicaraguaNigerNigeriaNorwayOmanPakistanPalauPanamaPapua New GuineaParaguayPeruPhilippinesPolandPortugalPuerto RicoQatarRomaniaRussian FederationRwandaSamoaSan MarinoSao Tome and PrincipeSaudi ArabiaSenegalSerbiaSeychellesSierra LeoneSingaporeSlovak RepublicSloveniaSolomon IslandsSomaliaSouth AfricaSouth SudanSpainSri LankaSt. Kitts and NevisSt. LuciaSt. Vincent and the GrenadinesSudanSurinameSwazilandSwedenSwitzerlandSyrian Arab RepublicTajikistanTanzaniaThailandTimor-LesteTogoTongaTrinidad and TobagoTunisiaTurkeyTurkmenistanTuvaluUgandaUkraineUnited Arab EmiratesUnited KingdomUnited StatesUruguayUzbekistanVanuatuVenezuela, RBVietnamVirgin Islands (U.S.)West Bank and GazaYemen, Rep.ZambiaZimbabwe Timeline:
This timeline shows a graph from 1961 to 2016 of Bahamas, The. No data until 1960. Number of actual observations by date: 56.
Source name:
World Development Indicators
Source organization:
World Bank national accounts data, and OECD National Accounts data files.
Categories, topics:
Economy & Growth
Last updated:
apr 23, 2017
Indicators value changes by year
Minimum:
11.721
jan 1, 1961
Maximum:
113.614
jan 1, 2016
At the date of observation
Value
Absolute change
Change from previous value
jan 1, 1961
11.721
+11.721
0.0%
jan 1, 1962
11.857
+0.136
1.16%
jan 1, 1963
11.986
+0.129
1.09%
jan 1, 1964
12.147
+0.161
1.34%
jan 1, 1965
12.33
+0.183
1.51%
jan 1, 1966
12.578
+0.248
2.01%
jan 1, 1967
13.053
+0.474
3.77%
jan 1, 1968
13.668
+0.615
4.71%
jan 1, 1969
14.373
+0.706
5.16%
jan 1, 1970
15.656
+1.283
8.93%
jan 1, 1971
16.618
+0.962
6.15%
jan 1, 1972
17.38
+0.762
4.58%
jan 1, 1973
18.56
+1.18
6.79%
jan 1, 1974
19.59
+1.03
5.55%
jan 1, 1975
22.182
+2.592
13.23%
jan 1, 1976
24.546
+2.364
10.66%
jan 1, 1977
25.132
+0.587
2.39%
jan 1, 1978
25.567
+0.434
1.73%
jan 1, 1979
26.142
+0.575
2.25%
jan 1, 1980
28.378
+2.236
8.55%
jan 1, 1981
31.218
+2.84
10.01%
jan 1, 1982
36.739
+5.522
17.69%
jan 1, 1983
38.097
+1.358
3.7%
jan 1, 1984
40.374
+2.277
5.98%
jan 1, 1985
41.654
+1.28
3.17%
jan 1, 1986
45.179
+3.524
8.46%
jan 1, 1987
47.284
+2.106
4.66%
jan 1, 1988
50.398
+3.114
6.59%
jan 1, 1989
51.147
+0.748
1.48%
jan 1, 1990
52.074
+0.927
1.81%
jan 1, 1991
54.716
+2.642
5.07%
jan 1, 1992
56.115
+1.399
2.56%
jan 1, 1993
58.306
+2.192
3.91%
jan 1, 1994
57.81
-0.497
-0.85%
jan 1, 1995
59.072
+1.262
2.18%
jan 1, 1996
59.546
+0.474
0.8%
jan 1, 1997
60.132
+0.586
0.98%
jan 1, 1998
80.99
+20.858
34.69%
jan 1, 1999
83.46
+2.47
3.05%
jan 1, 2000
87.592
+4.132
4.95%
jan 1, 2001
88.399
+0.807
0.92%
jan 1, 2002
88.712
+0.313
0.35%
jan 1, 2003
92.226
+3.514
3.96%
jan 1, 2004
93.291
+1.065
1.15%
jan 1, 2005
94.405
+1.114
1.19%
jan 1, 2006
99.179
+4.774
5.06%
jan 1, 2007
100.0
+0.821
0.83%
jan 1, 2008
102.948
+2.948
2.95%
jan 1, 2009
104.48
+1.533
1.49%
jan 1, 2010
103.397
-1.083
-1.04%
jan 1, 2011
102.991
-0.406
-0.39%
jan 1, 2012
102.107
-0.884
-0.86%
jan 1, 2013
105.444
+3.336
3.27%
jan 1, 2014
106.976
+1.533
1.45%
jan 1, 2015
108.749
+1.772
1.66%
jan 1, 2016
113.614
+4.865
4.47%
Ranking of countries by current statistics by years


Comments: