29
/
en
AIzaSyAYiBZKx7MnpbEhh9jyipgxe19OcubqV5w
April 1, 2024
85118
Bermuda
BMU
true
2
1
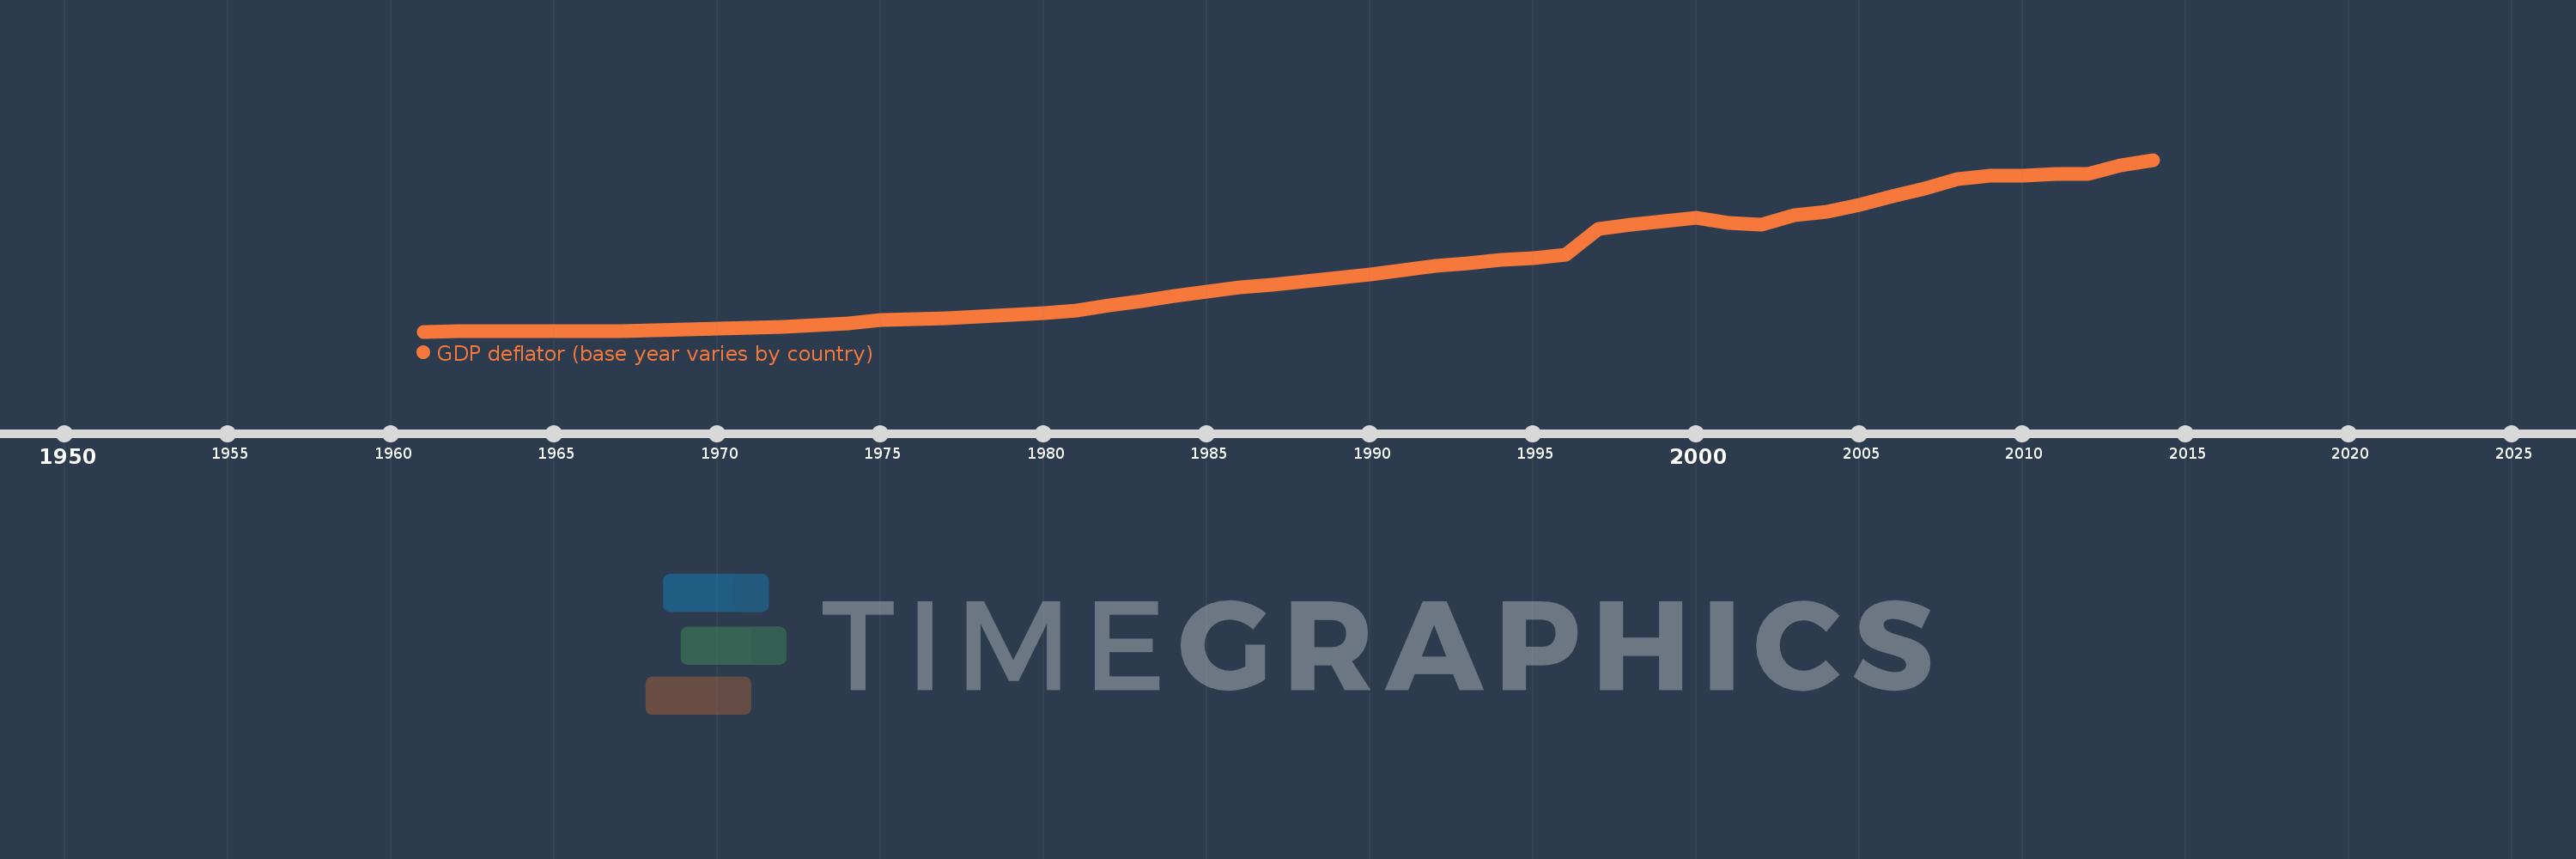
GDP deflator (base year varies by country)
2014,2013,2012,2011,2010,2009,2008,2007,2006,2005,2004,2003,2002,2001,2000,1999,1998,1997,1996,1995,1994,1993,1992,1991,1990,1989,1988,1987,1986,1985,1984,1983,1982,1981,1980,1979,1978,1977,1976,1975,1974,1973,1972,1971,1970,1969,1968,1967,1966,1965,1964,1963,1962,1961
This statistics in other country:
AfghanistanAlbaniaAlgeriaAndorraAngolaAntigua and BarbudaArgentinaArmeniaArubaAustraliaAustriaAzerbaijanBahamas, TheBahrainBangladeshBarbadosBelarusBelgiumBelizeBeninBermudaBhutanBoliviaBosnia and HerzegovinaBotswanaBrazilBrunei DarussalamBulgariaBurkina FasoBurundiCabo VerdeCambodiaCameroonCanadaCayman IslandsCentral African RepublicChadChannel IslandsChileChinaColombiaComorosCongo, Dem. Rep.Congo, Rep.Costa RicaCote d'IvoireCroatiaCubaCyprusCzech RepublicDenmarkDjiboutiDominicaDominican RepublicEcuadorEgypt, Arab Rep.El SalvadorEquatorial GuineaEritreaEstoniaEthiopiaFijiFinlandFranceFrench PolynesiaGabonGambia, TheGeorgiaGermanyGhanaGreeceGreenlandGrenadaGuatemalaGuineaGuinea-BissauGuyanaHaitiHondurasHong Kong SAR, ChinaHungaryIcelandIndiaIndonesiaIran, Islamic Rep.IraqIrelandIsle of ManIsraelItalyJamaicaJapanJordanKazakhstanKenyaKiribatiKorea, Rep.KosovoKuwaitKyrgyz RepublicLao PDRLatviaLebanonLesothoLiberiaLibyaLiechtensteinLithuaniaLuxembourgMacao SAR, ChinaMacedonia, FYRMadagascarMalawiMalaysiaMaldivesMaliMaltaMarshall IslandsMauritaniaMauritiusMexicoMicronesia, Fed. Sts.MoldovaMonacoMongoliaMontenegroMoroccoMozambiqueMyanmarNamibiaNauruNepalNetherlandsNew CaledoniaNew ZealandNicaraguaNigerNigeriaNorwayOmanPakistanPalauPanamaPapua New GuineaParaguayPeruPhilippinesPolandPortugalPuerto RicoQatarRomaniaRussian FederationRwandaSamoaSan MarinoSao Tome and PrincipeSaudi ArabiaSenegalSerbiaSeychellesSierra LeoneSingaporeSlovak RepublicSloveniaSolomon IslandsSomaliaSouth AfricaSouth SudanSpainSri LankaSt. Kitts and NevisSt. LuciaSt. Vincent and the GrenadinesSudanSurinameSwazilandSwedenSwitzerlandSyrian Arab RepublicTajikistanTanzaniaThailandTimor-LesteTogoTongaTrinidad and TobagoTunisiaTurkeyTurkmenistanTuvaluUgandaUkraineUnited Arab EmiratesUnited KingdomUnited StatesUruguayUzbekistanVanuatuVenezuela, RBVietnamVirgin Islands (U.S.)West Bank and GazaYemen, Rep.ZambiaZimbabwe Timeline:
This timeline shows a graph from 1961 to 2014 of Bermuda. No data until 1960. Number of actual observations by date: 54.
Source name:
World Development Indicators
Source organization:
World Bank national accounts data, and OECD National Accounts data files.
Categories, topics:
Economy & Growth
Last updated:
apr 23, 2017
Indicators value changes by year
Maximum:
118.554
jan 1, 2014
At the date of observation
Value
Absolute change
Change from previous value
jan 1, 1961
6.418
+6.418
0.0%
jan 1, 1962
6.478
+0.06
0.94%
jan 1, 1963
6.542
+0.063
0.98%
jan 1, 1964
6.625
+0.083
1.27%
jan 1, 1965
6.655
+0.031
0.46%
jan 1, 1966
6.753
+0.097
1.46%
jan 1, 1967
6.929
+0.176
2.61%
jan 1, 1968
7.17
+0.241
3.48%
jan 1, 1969
7.814
+0.644
8.98%
jan 1, 1970
8.305
+0.491
6.28%
jan 1, 1971
8.825
+0.521
6.27%
jan 1, 1972
9.668
+0.842
9.55%
jan 1, 1973
10.589
+0.921
9.53%
jan 1, 1974
11.945
+1.357
12.81%
jan 1, 1975
13.735
+1.79
14.98%
jan 1, 1976
14.608
+0.873
6.36%
jan 1, 1977
15.015
+0.407
2.78%
jan 1, 1978
16.407
+1.392
9.27%
jan 1, 1979
17.214
+0.807
4.92%
jan 1, 1980
18.318
+1.104
6.42%
jan 1, 1981
20.123
+1.805
9.85%
jan 1, 1982
23.687
+3.564
17.71%
jan 1, 1983
26.579
+2.892
12.21%
jan 1, 1984
29.502
+2.923
11.0%
jan 1, 1985
32.54
+3.038
10.3%
jan 1, 1986
35.017
+2.478
7.61%
jan 1, 1987
37.06
+2.043
5.84%
jan 1, 1988
39.465
+2.405
6.49%
jan 1, 1989
41.396
+1.931
4.89%
jan 1, 1990
43.729
+2.333
5.64%
jan 1, 1991
46.368
+2.638
6.03%
jan 1, 1992
49.35
+2.982
6.43%
jan 1, 1993
50.738
+1.389
2.81%
jan 1, 1994
53.375
+2.637
5.2%
jan 1, 1995
54.421
+1.046
1.96%
jan 1, 1996
56.695
+2.274
4.18%
jan 1, 1997
73.343
+16.648
29.36%
jan 1, 1998
76.294
+2.951
4.02%
jan 1, 1999
78.386
+2.092
2.74%
jan 1, 2000
80.512
+2.126
2.71%
jan 1, 2001
77.101
-3.411
-4.24%
jan 1, 2002
76.045
-1.056
-1.37%
jan 1, 2003
82.57
+6.525
8.58%
jan 1, 2004
84.903
+2.332
2.82%
jan 1, 2005
88.886
+3.984
4.69%
jan 1, 2006
94.897
+6.011
6.76%
jan 1, 2007
100.0
+5.103
5.38%
jan 1, 2008
105.866
+5.866
5.87%
jan 1, 2009
108.074
+2.208
2.09%
jan 1, 2010
108.435
+0.361
0.33%
jan 1, 2011
109.572
+1.137
1.05%
jan 1, 2012
109.536
-0.036
-0.03%
jan 1, 2013
114.827
+5.29
4.83%
jan 1, 2014
118.554
+3.727
3.25%
Ranking of countries by current statistics by years


Comments: