29
/
en
AIzaSyAYiBZKx7MnpbEhh9jyipgxe19OcubqV5w
April 1, 2024
219573
Papua New Guinea
PNG
true
2
1
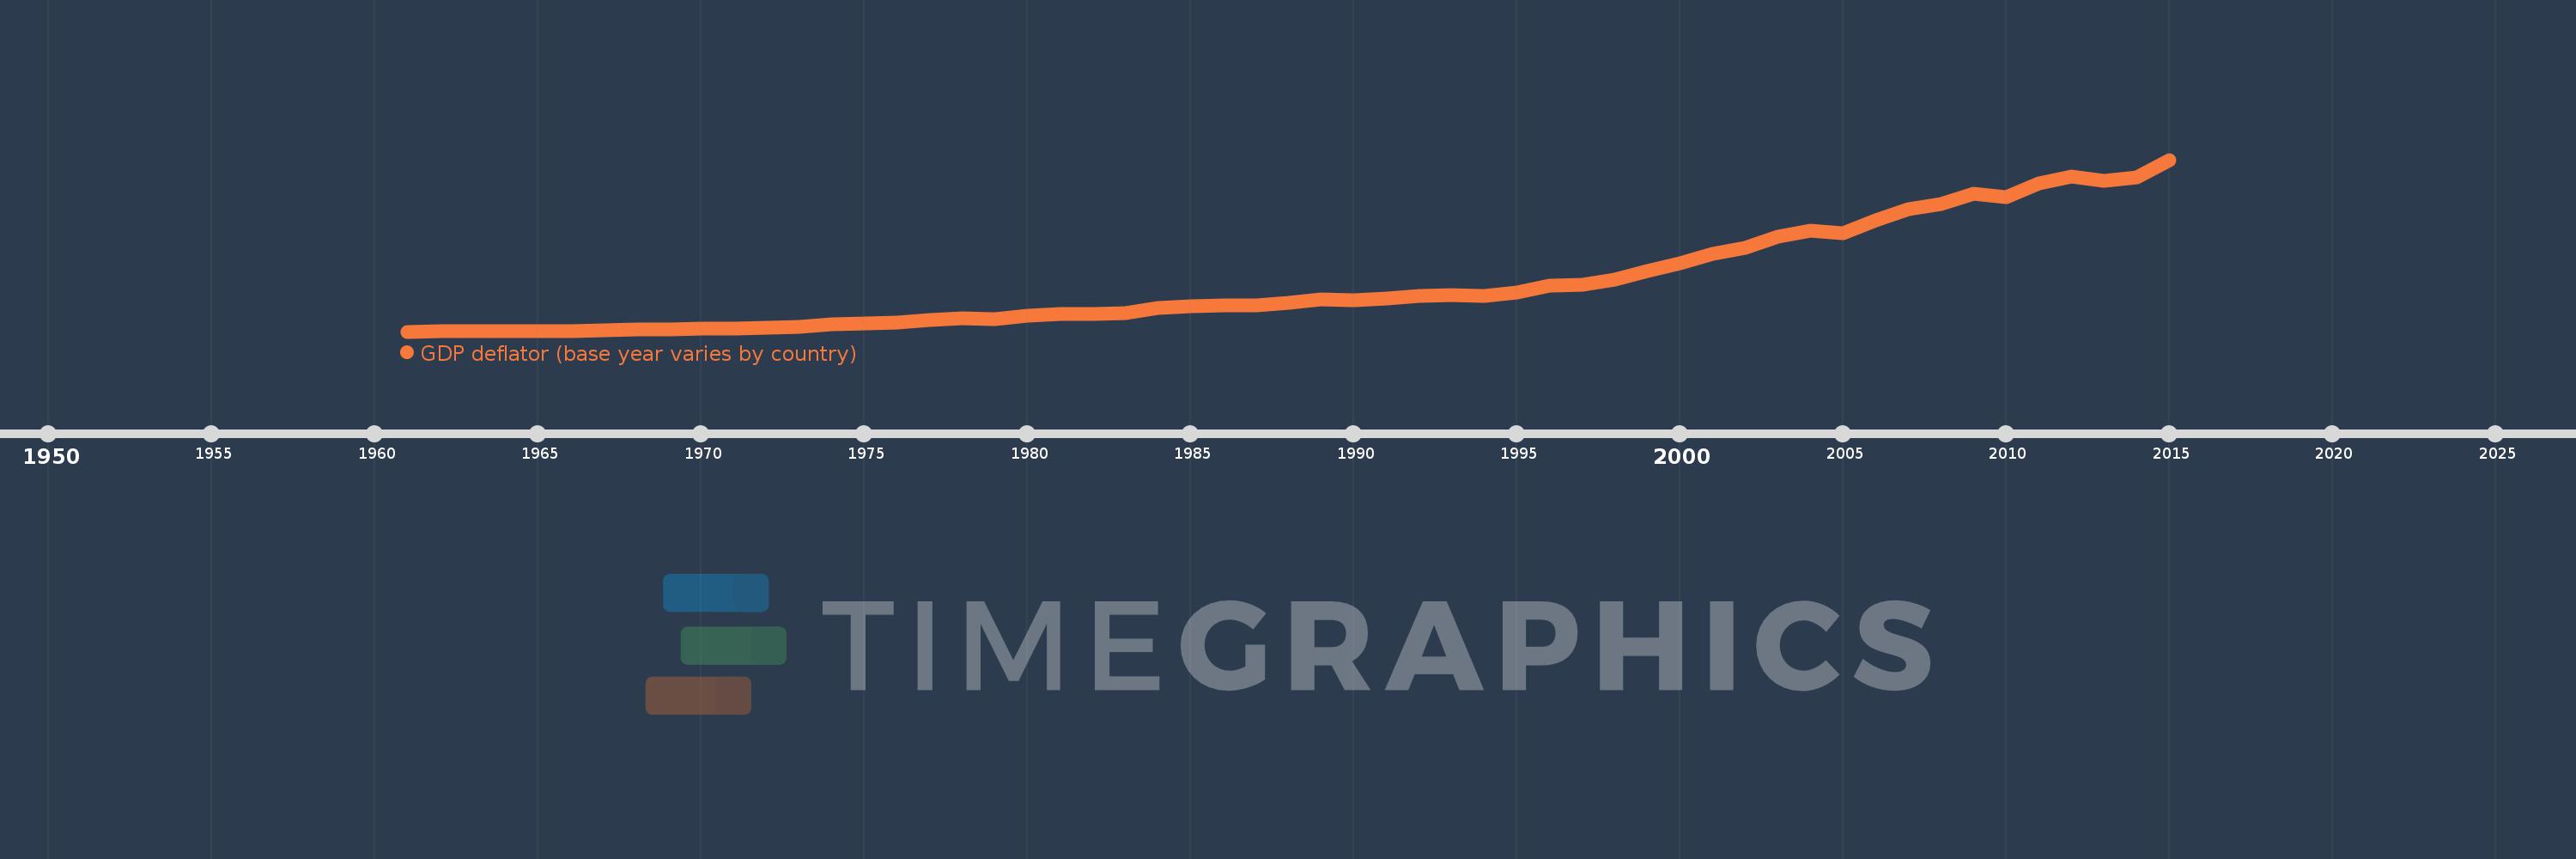
GDP deflator (base year varies by country)
2015,2014,2013,2012,2011,2010,2009,2008,2007,2006,2005,2004,2003,2002,2001,2000,1999,1998,1997,1996,1995,1994,1993,1992,1991,1990,1989,1988,1987,1986,1985,1984,1983,1982,1981,1980,1979,1978,1977,1976,1975,1974,1973,1972,1971,1970,1969,1968,1967,1966,1965,1964,1963,1962,1961
This statistics in other country:
AfghanistanAlbaniaAlgeriaAndorraAngolaAntigua and BarbudaArgentinaArmeniaArubaAustraliaAustriaAzerbaijanBahamas, TheBahrainBangladeshBarbadosBelarusBelgiumBelizeBeninBermudaBhutanBoliviaBosnia and HerzegovinaBotswanaBrazilBrunei DarussalamBulgariaBurkina FasoBurundiCabo VerdeCambodiaCameroonCanadaCayman IslandsCentral African RepublicChadChannel IslandsChileChinaColombiaComorosCongo, Dem. Rep.Congo, Rep.Costa RicaCote d'IvoireCroatiaCubaCyprusCzech RepublicDenmarkDjiboutiDominicaDominican RepublicEcuadorEgypt, Arab Rep.El SalvadorEquatorial GuineaEritreaEstoniaEthiopiaFijiFinlandFranceFrench PolynesiaGabonGambia, TheGeorgiaGermanyGhanaGreeceGreenlandGrenadaGuatemalaGuineaGuinea-BissauGuyanaHaitiHondurasHong Kong SAR, ChinaHungaryIcelandIndiaIndonesiaIran, Islamic Rep.IraqIrelandIsle of ManIsraelItalyJamaicaJapanJordanKazakhstanKenyaKiribatiKorea, Rep.KosovoKuwaitKyrgyz RepublicLao PDRLatviaLebanonLesothoLiberiaLibyaLiechtensteinLithuaniaLuxembourgMacao SAR, ChinaMacedonia, FYRMadagascarMalawiMalaysiaMaldivesMaliMaltaMarshall IslandsMauritaniaMauritiusMexicoMicronesia, Fed. Sts.MoldovaMonacoMongoliaMontenegroMoroccoMozambiqueMyanmarNamibiaNauruNepalNetherlandsNew CaledoniaNew ZealandNicaraguaNigerNigeriaNorwayOmanPakistanPalauPanamaPapua New GuineaParaguayPeruPhilippinesPolandPortugalPuerto RicoQatarRomaniaRussian FederationRwandaSamoaSan MarinoSao Tome and PrincipeSaudi ArabiaSenegalSerbiaSeychellesSierra LeoneSingaporeSlovak RepublicSloveniaSolomon IslandsSomaliaSouth AfricaSouth SudanSpainSri LankaSt. Kitts and NevisSt. LuciaSt. Vincent and the GrenadinesSudanSurinameSwazilandSwedenSwitzerlandSyrian Arab RepublicTajikistanTanzaniaThailandTimor-LesteTogoTongaTrinidad and TobagoTunisiaTurkeyTurkmenistanTuvaluUgandaUkraineUnited Arab EmiratesUnited KingdomUnited StatesUruguayUzbekistanVanuatuVenezuela, RBVietnamVirgin Islands (U.S.)West Bank and GazaYemen, Rep.ZambiaZimbabwe Timeline:
This timeline shows a graph from 1961 to 2015 of Papua New Guinea. No data until 1960. Number of actual observations by date: 55.
Source name:
World Development Indicators
Source organization:
World Bank national accounts data, and OECD National Accounts data files.
Categories, topics:
Economy & Growth
Last updated:
apr 23, 2017
Indicators value changes by year
Minimum:
11.171
jan 1, 1961
Maximum:
264.006
jan 1, 2015
At the date of observation
Value
Absolute change
Change from previous value
jan 1, 1961
11.171
+11.171
0.0%
jan 1, 1962
11.175
+0.004
0.04%
jan 1, 1963
11.207
+0.032
0.29%
jan 1, 1964
11.378
+0.171
1.53%
jan 1, 1965
11.594
+0.216
1.9%
jan 1, 1966
11.853
+0.259
2.23%
jan 1, 1967
12.725
+0.872
7.36%
jan 1, 1968
13.814
+1.089
8.56%
jan 1, 1969
14.54
+0.725
5.25%
jan 1, 1970
15.257
+0.718
4.94%
jan 1, 1971
16.12
+0.862
5.65%
jan 1, 1972
16.67
+0.55
3.41%
jan 1, 1973
17.859
+1.189
7.13%
jan 1, 1974
21.384
+3.525
19.74%
jan 1, 1975
23.291
+1.907
8.92%
jan 1, 1976
23.82
+0.529
2.27%
jan 1, 1977
28.517
+4.697
19.72%
jan 1, 1978
30.638
+2.121
7.44%
jan 1, 1979
30.016
-0.622
-2.03%
jan 1, 1980
34.848
+4.832
16.1%
jan 1, 1981
37.319
+2.471
7.09%
jan 1, 1982
36.833
-0.486
-1.3%
jan 1, 1983
38.188
+1.355
3.68%
jan 1, 1984
45.314
+7.126
18.66%
jan 1, 1985
48.684
+3.371
7.44%
jan 1, 1986
49.473
+0.789
1.62%
jan 1, 1987
50.144
+0.671
1.36%
jan 1, 1988
54.142
+3.997
7.97%
jan 1, 1989
58.432
+4.29
7.92%
jan 1, 1990
56.947
-1.485
-2.54%
jan 1, 1991
59.304
+2.357
4.14%
jan 1, 1992
63.452
+4.148
6.99%
jan 1, 1993
65.277
+1.825
2.88%
jan 1, 1994
63.648
-1.629
-2.5%
jan 1, 1995
68.264
+4.616
7.25%
jan 1, 1996
79.085
+10.821
15.85%
jan 1, 1997
80.518
+1.433
1.81%
jan 1, 1998
87.303
+6.785
8.43%
jan 1, 1999
100.0
+12.697
14.54%
jan 1, 2000
111.069
+11.069
11.07%
jan 1, 2001
125.622
+14.553
13.1%
jan 1, 2002
134.307
+8.685
6.91%
jan 1, 2003
150.814
+16.507
12.29%
jan 1, 2004
159.168
+8.354
5.54%
jan 1, 2005
155.997
-3.171
-1.99%
jan 1, 2006
175.001
+19.004
12.18%
jan 1, 2007
191.511
+16.51
9.43%
jan 1, 2008
198.879
+7.368
3.85%
jan 1, 2009
214.317
+15.438
7.76%
jan 1, 2010
208.74
-5.577
-2.6%
jan 1, 2011
229.369
+20.629
9.88%
jan 1, 2012
239.426
+10.057
4.38%
jan 1, 2013
232.745
-6.68
-2.79%
jan 1, 2014
237.897
+5.152
2.21%
jan 1, 2015
264.006
+26.108
10.97%
Ranking of countries by current statistics by years


Comments: