29
/
en
AIzaSyAYiBZKx7MnpbEhh9jyipgxe19OcubqV5w
April 1, 2024
135520
Gabon
GAB
true
2
1
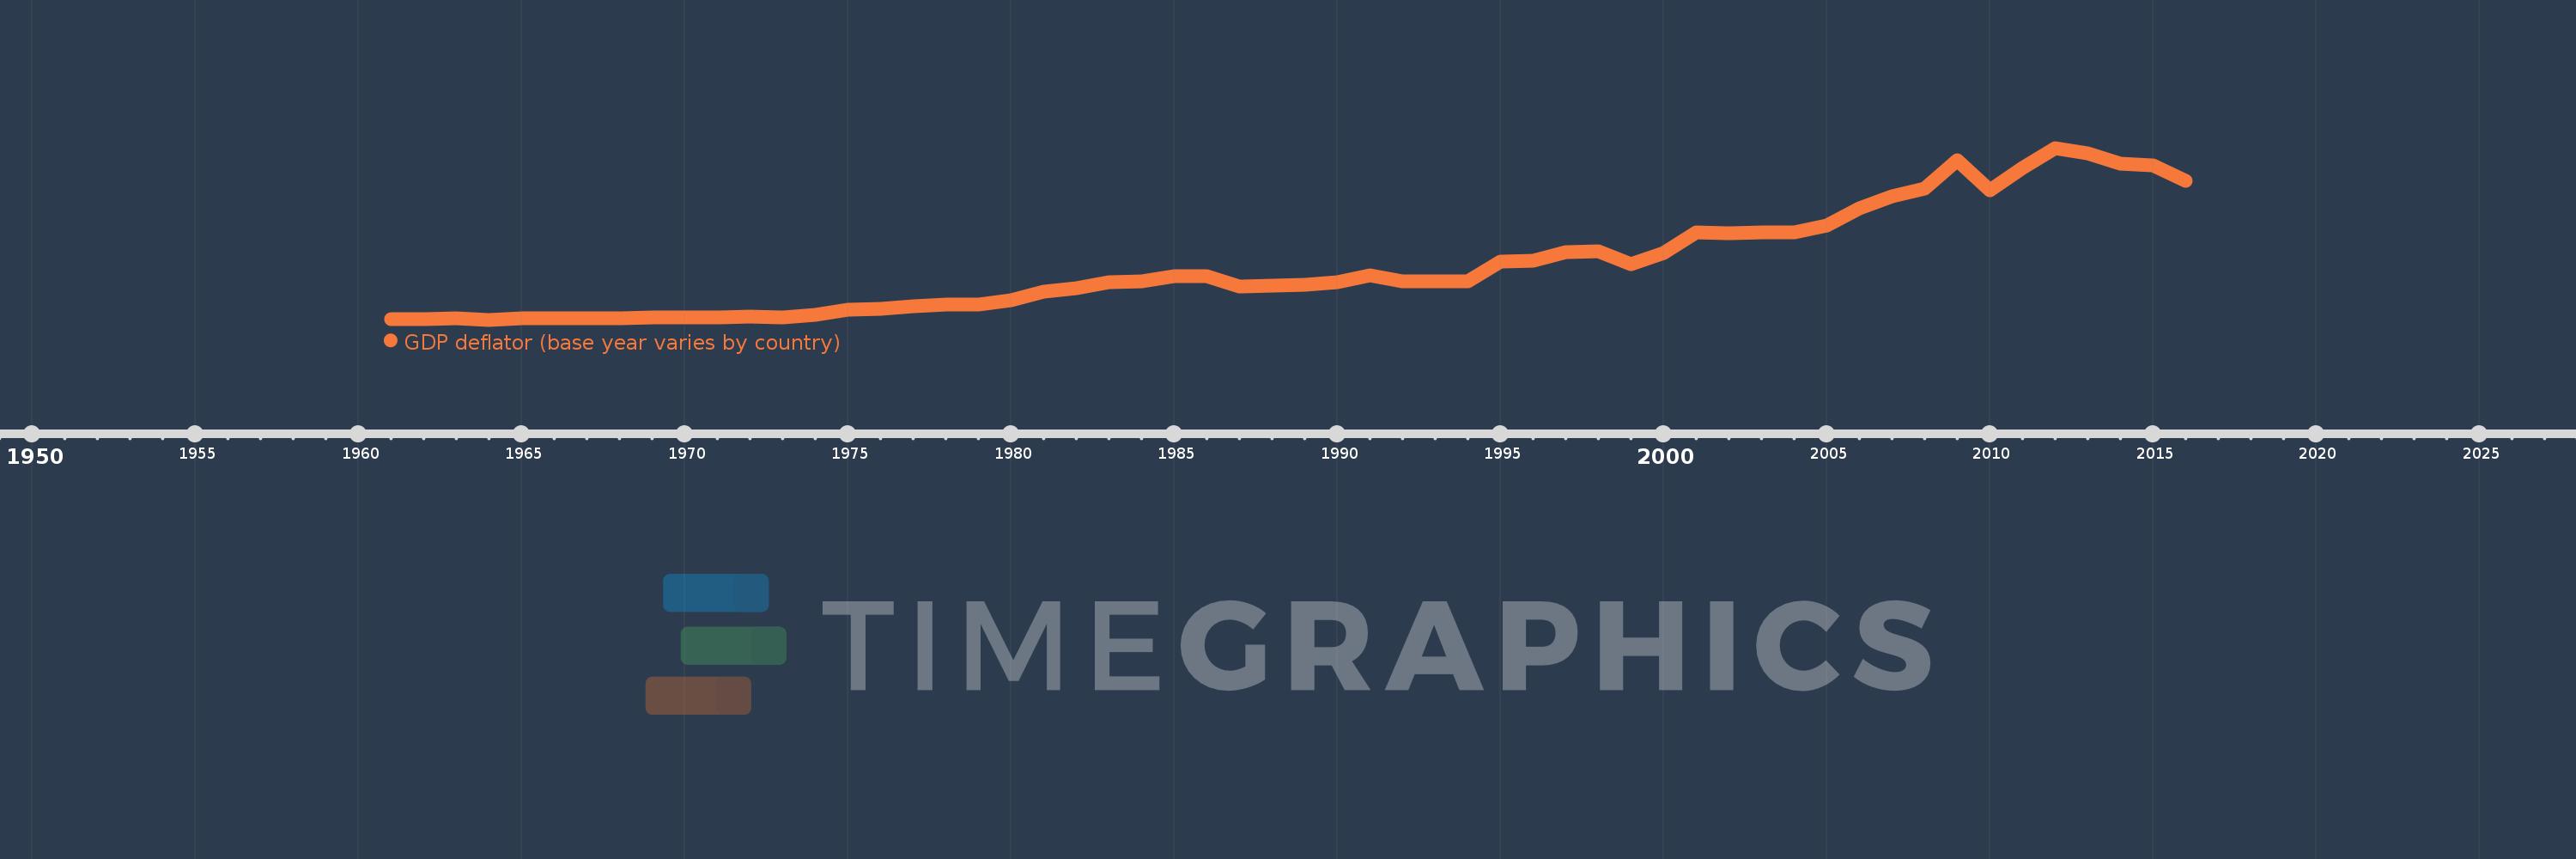
GDP deflator (base year varies by country)
2016,2015,2014,2013,2012,2011,2010,2009,2008,2007,2006,2005,2004,2003,2002,2001,2000,1999,1998,1997,1996,1995,1994,1993,1992,1991,1990,1989,1988,1987,1986,1985,1984,1983,1982,1981,1980,1979,1978,1977,1976,1975,1974,1973,1972,1971,1970,1969,1968,1967,1966,1965,1964,1963,1962,1961
This statistics in other country:
AfghanistanAlbaniaAlgeriaAndorraAngolaAntigua and BarbudaArgentinaArmeniaArubaAustraliaAustriaAzerbaijanBahamas, TheBahrainBangladeshBarbadosBelarusBelgiumBelizeBeninBermudaBhutanBoliviaBosnia and HerzegovinaBotswanaBrazilBrunei DarussalamBulgariaBurkina FasoBurundiCabo VerdeCambodiaCameroonCanadaCayman IslandsCentral African RepublicChadChannel IslandsChileChinaColombiaComorosCongo, Dem. Rep.Congo, Rep.Costa RicaCote d'IvoireCroatiaCubaCyprusCzech RepublicDenmarkDjiboutiDominicaDominican RepublicEcuadorEgypt, Arab Rep.El SalvadorEquatorial GuineaEritreaEstoniaEthiopiaFijiFinlandFranceFrench PolynesiaGabonGambia, TheGeorgiaGermanyGhanaGreeceGreenlandGrenadaGuatemalaGuineaGuinea-BissauGuyanaHaitiHondurasHong Kong SAR, ChinaHungaryIcelandIndiaIndonesiaIran, Islamic Rep.IraqIrelandIsle of ManIsraelItalyJamaicaJapanJordanKazakhstanKenyaKiribatiKorea, Rep.KosovoKuwaitKyrgyz RepublicLao PDRLatviaLebanonLesothoLiberiaLibyaLiechtensteinLithuaniaLuxembourgMacao SAR, ChinaMacedonia, FYRMadagascarMalawiMalaysiaMaldivesMaliMaltaMarshall IslandsMauritaniaMauritiusMexicoMicronesia, Fed. Sts.MoldovaMonacoMongoliaMontenegroMoroccoMozambiqueMyanmarNamibiaNauruNepalNetherlandsNew CaledoniaNew ZealandNicaraguaNigerNigeriaNorwayOmanPakistanPalauPanamaPapua New GuineaParaguayPeruPhilippinesPolandPortugalPuerto RicoQatarRomaniaRussian FederationRwandaSamoaSan MarinoSao Tome and PrincipeSaudi ArabiaSenegalSerbiaSeychellesSierra LeoneSingaporeSlovak RepublicSloveniaSolomon IslandsSomaliaSouth AfricaSouth SudanSpainSri LankaSt. Kitts and NevisSt. LuciaSt. Vincent and the GrenadinesSudanSurinameSwazilandSwedenSwitzerlandSyrian Arab RepublicTajikistanTanzaniaThailandTimor-LesteTogoTongaTrinidad and TobagoTunisiaTurkeyTurkmenistanTuvaluUgandaUkraineUnited Arab EmiratesUnited KingdomUnited StatesUruguayUzbekistanVanuatuVenezuela, RBVietnamVirgin Islands (U.S.)West Bank and GazaYemen, Rep.ZambiaZimbabwe Timeline:
This timeline shows a graph from 1961 to 2016 of Gabon. No data until 1960. Number of actual observations by date: 56.
Source name:
World Development Indicators
Source organization:
World Bank national accounts data, and OECD National Accounts data files.
Categories, topics:
Economy & Growth
Last updated:
apr 23, 2017
Indicators value changes by year
Maximum:
193.364
jan 1, 2012
At the date of observation
Value
Absolute change
Change from previous value
jan 1, 1962
5.68
+0.18
3.28%
jan 1, 1963
5.759
+0.078
1.38%
jan 1, 1964
4.587
-1.172
-20.34%
jan 1, 1965
6.126
+1.539
33.54%
jan 1, 1966
5.939
-0.187
-3.06%
jan 1, 1967
6.184
+0.246
4.13%
jan 1, 1968
6.569
+0.385
6.22%
jan 1, 1969
6.994
+0.424
6.46%
jan 1, 1970
7.34
+0.347
4.96%
jan 1, 1971
7.31
-0.031
-0.42%
jan 1, 1972
7.785
+0.475
6.5%
jan 1, 1973
7.218
-0.567
-7.28%
jan 1, 1974
9.727
+2.509
34.76%
jan 1, 1975
16.09
+6.363
65.41%
jan 1, 1976
16.794
+0.703
4.37%
jan 1, 1977
19.256
+2.463
14.66%
jan 1, 1978
21.143
+1.886
9.8%
jan 1, 1979
21.747
+0.604
2.86%
jan 1, 1980
25.875
+4.128
18.98%
jan 1, 1981
35.393
+9.517
36.78%
jan 1, 1982
39.088
+3.696
10.44%
jan 1, 1983
45.696
+6.607
16.9%
jan 1, 1984
47.032
+1.337
2.92%
jan 1, 1985
52.681
+5.649
12.01%
jan 1, 1986
52.009
-0.672
-1.28%
jan 1, 1987
41.186
-10.823
-20.81%
jan 1, 1988
41.595
+0.409
0.99%
jan 1, 1989
42.683
+1.088
2.62%
jan 1, 1990
45.981
+3.299
7.73%
jan 1, 1991
53.043
+7.062
15.36%
jan 1, 1992
47.014
-6.029
-11.37%
jan 1, 1993
47.115
+0.101
0.21%
jan 1, 1994
46.875
-0.24
-0.51%
jan 1, 1995
68.695
+21.821
46.55%
jan 1, 1996
69.615
+0.92
1.34%
jan 1, 1997
79.057
+9.442
13.56%
jan 1, 1998
79.805
+0.748
0.95%
jan 1, 1999
65.611
-14.194
-17.79%
jan 1, 2000
78.202
+12.592
19.19%
jan 1, 2001
100.169
+21.967
28.09%
jan 1, 2002
100.0
-0.169
-0.17%
jan 1, 2003
100.856
+0.856
0.86%
jan 1, 2004
100.637
-0.219
-0.22%
jan 1, 2005
108.452
+7.815
7.77%
jan 1, 2006
127.096
+18.644
17.19%
jan 1, 2007
140.354
+13.258
10.43%
jan 1, 2008
149.152
+8.798
6.27%
jan 1, 2009
179.697
+30.545
20.48%
jan 1, 2010
147.217
-32.479
-18.07%
jan 1, 2011
171.603
+24.386
16.56%
jan 1, 2012
193.364
+21.761
12.68%
jan 1, 2013
187.676
-5.689
-2.94%
jan 1, 2014
176.119
-11.557
-6.16%
jan 1, 2015
174.62
-1.499
-0.85%
jan 1, 2016
157.553
-17.067
-9.77%
Ranking of countries by current statistics by years


Comments: