29
/
en
AIzaSyAYiBZKx7MnpbEhh9jyipgxe19OcubqV5w
April 1, 2024
238909
Sierra Leone
SLE
true
2
1
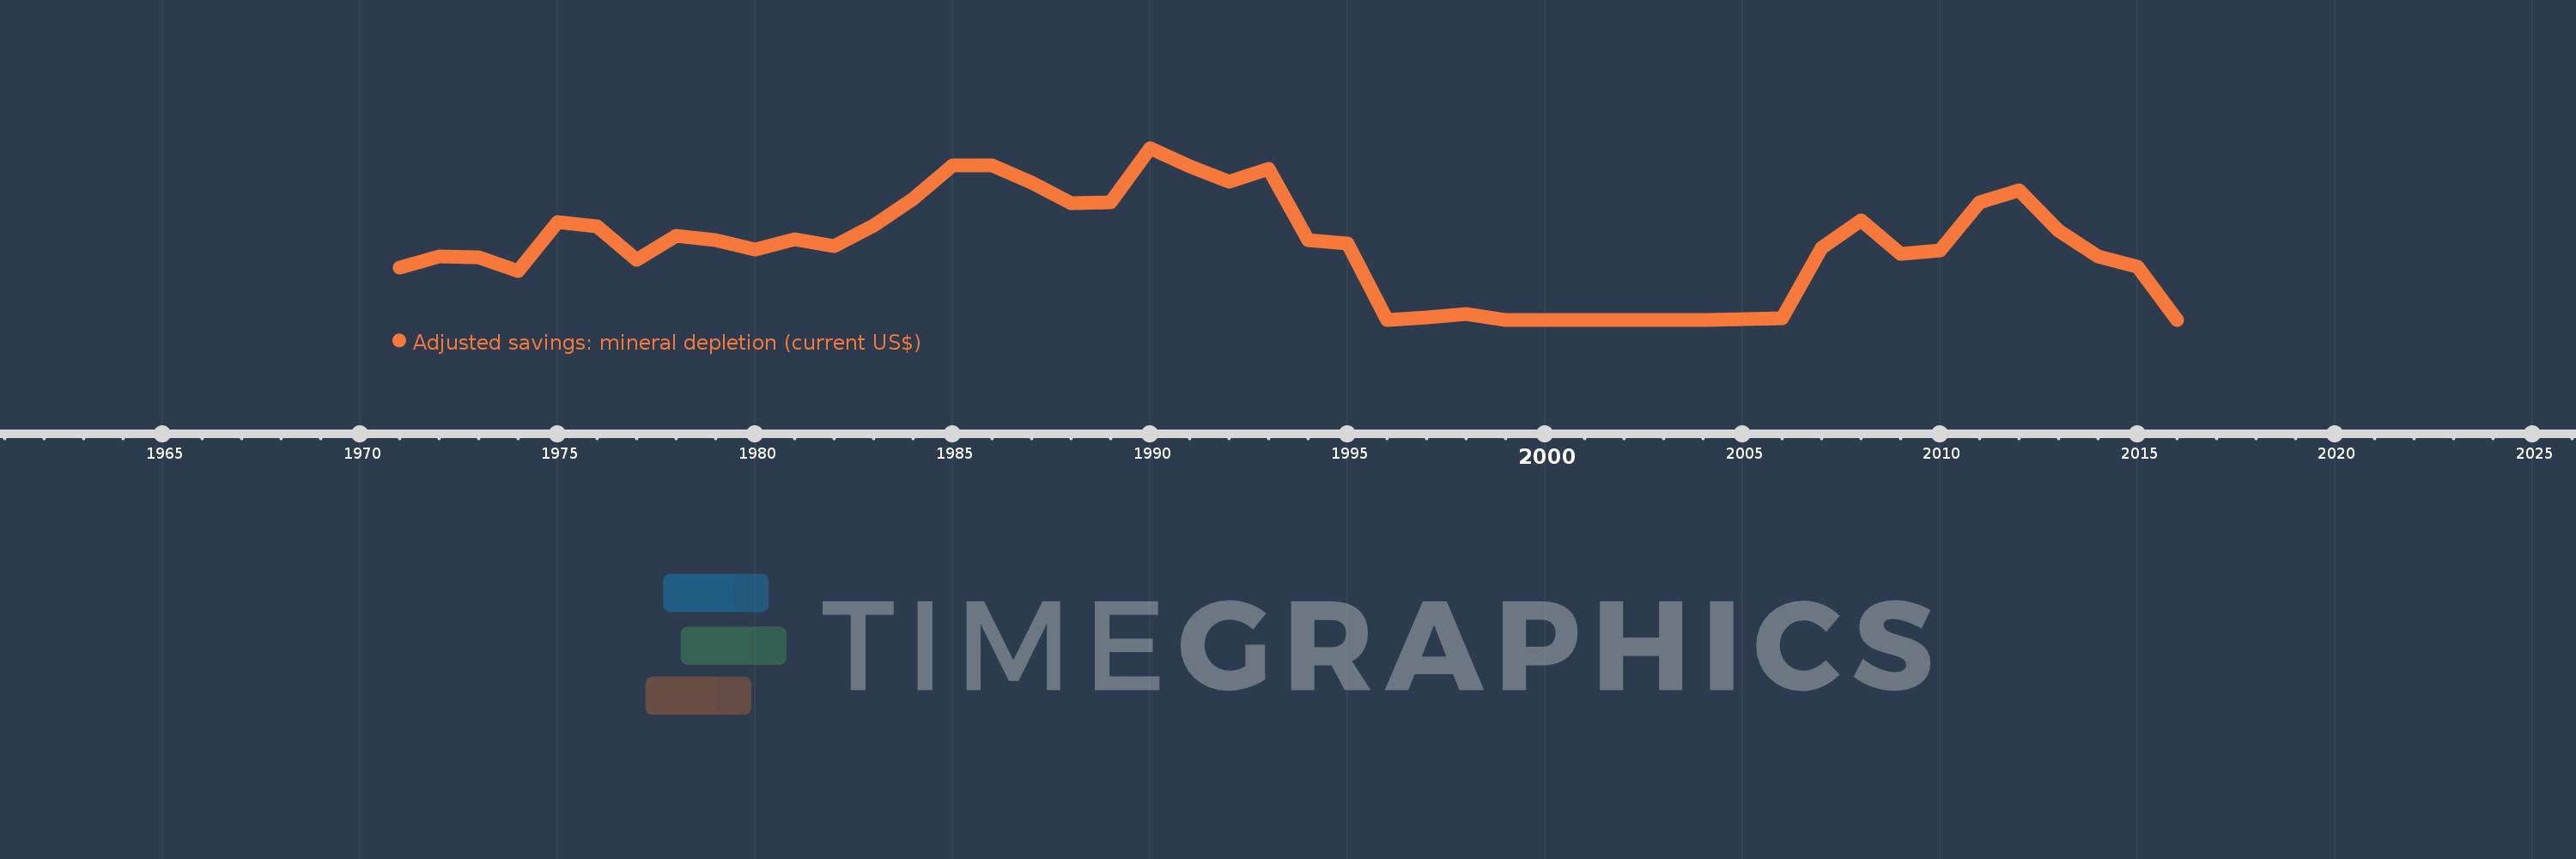
Adjusted savings: mineral depletion (current US$)
2016,2015,2014,2013,2012,2011,2010,2009,2008,2007,2006,2005,2004,2003,2002,2001,2000,1999,1998,1997,1996,1995,1994,1993,1992,1991,1990,1989,1988,1987,1986,1985,1984,1983,1982,1981,1980,1979,1978,1977,1976,1975,1974,1973,1972,1971
This statistics in other country:
AfghanistanAlbaniaAlgeriaAmerican SamoaAndorraAngolaAntigua and BarbudaArgentinaArmeniaArubaAustraliaAustriaAzerbaijanBahamas, TheBahrainBangladeshBarbadosBelarusBelgiumBelizeBeninBermudaBhutanBoliviaBosnia and HerzegovinaBotswanaBrazilBrunei DarussalamBulgariaBurkina FasoBurundiCabo VerdeCambodiaCameroonCanadaCayman IslandsCentral African RepublicChadChannel IslandsChileChinaColombiaComorosCongo, Dem. Rep.Congo, Rep.Costa RicaCote d'IvoireCroatiaCubaCuracaoCyprusCzech RepublicDenmarkDjiboutiDominicaDominican RepublicEcuadorEgypt, Arab Rep.El SalvadorEquatorial GuineaEritreaEstoniaEthiopiaFaroe IslandsFijiFinlandFranceFrench PolynesiaGabonGambia, TheGeorgiaGermanyGhanaGibraltarGreeceGreenlandGrenadaGuamGuatemalaGuineaGuinea-BissauGuyanaHaitiHondurasHong Kong SAR, ChinaHungaryIcelandIndiaIndonesiaIran, Islamic Rep.IraqIrelandIsle of ManIsraelItalyJamaicaJapanJordanKazakhstanKenyaKiribatiKorea, Dem. People’s Rep.Korea, Rep.KosovoKuwaitKyrgyz RepublicLao PDRLatviaLebanonLesothoLiberiaLibyaLiechtensteinLithuaniaLuxembourgMacao SAR, ChinaMacedonia, FYRMadagascarMalawiMalaysiaMaldivesMaliMaltaMarshall IslandsMauritaniaMauritiusMexicoMicronesia, Fed. Sts.MoldovaMonacoMongoliaMontenegroMoroccoMozambiqueMyanmarNamibiaNepalNetherlandsNew CaledoniaNew ZealandNicaraguaNigerNigeriaNorthern Mariana IslandsNorwayOmanPakistanPalauPanamaPapua New GuineaParaguayPeruPhilippinesPolandPortugalPuerto RicoQatarRomaniaRussian FederationRwandaSamoaSan MarinoSao Tome and PrincipeSaudi ArabiaSenegalSerbiaSeychellesSierra LeoneSingaporeSint Maarten (Dutch part)Slovak RepublicSloveniaSolomon IslandsSomaliaSouth AfricaSouth SudanSpainSri LankaSt. Kitts and NevisSt. LuciaSt. Martin (French part)St. Vincent and the GrenadinesSudanSurinameSwazilandSwedenSwitzerlandSyrian Arab RepublicTajikistanTanzaniaThailandTimor-LesteTogoTongaTrinidad and TobagoTunisiaTurkeyTurkmenistanTurks and Caicos IslandsTuvaluUgandaUkraineUnited Arab EmiratesUnited KingdomUnited StatesUruguayUzbekistanVanuatuVenezuela, RBVietnamVirgin Islands (U.S.)West Bank and GazaYemen, Rep.ZambiaZimbabwe Timeline:
This timeline shows a graph from 1971 to 2016 of Sierra Leone. No data until 1970. Number of actual observations by date: 46.
Source name:
World Development Indicators
Source organization:
World Bank staff estimates based on sources and methods in World Bank's "The Changing Wealth of Nations: Measuring Sustainable Development in the New Millennium" (2011).
Categories, topics:
Economy & Growth, Energy & Mining, Environment
Last updated:
apr 23, 2017
Indicators value changes by year
Maximum:
15.418 mln
jan 1, 1990
At the date of observation
Value
Absolute change
Change from previous value
jan 1, 1971
4.715 mln
+4.715 mln
0.0%
jan 1, 1972
5.677 mln
+961.848K
20.4%
jan 1, 1973
5.617 mln
-59.442K
-1.05%
jan 1, 1974
4.362 mln
-1.255 mln
-22.34%
jan 1, 1975
8.802 mln
+4.439 mln
101.76%
jan 1, 1976
8.382 mln
-420.036K
-4.77%
jan 1, 1977
5.389 mln
-2.993 mln
-35.71%
jan 1, 1978
7.522 mln
+2.133 mln
39.59%
jan 1, 1979
7.15 mln
-372.656K
-4.95%
jan 1, 1980
6.294 mln
-855.962K
-11.97%
jan 1, 1981
7.193 mln
+899.695K
14.3%
jan 1, 1982
6.608 mln
-585.541K
-8.14%
jan 1, 1983
8.448 mln
+1.84 mln
27.85%
jan 1, 1984
10.866 mln
+2.418 mln
28.62%
jan 1, 1985
13.85 mln
+2.984 mln
27.47%
jan 1, 1986
13.815 mln
-35.453K
-0.26%
jan 1, 1987
12.286 mln
-1.528 mln
-11.06%
jan 1, 1988
10.461 mln
-1.825 mln
-14.86%
jan 1, 1989
10.538 mln
+76.574K
0.73%
jan 1, 1990
15.418 mln
+4.88 mln
46.31%
jan 1, 1991
13.782 mln
-1.636 mln
-10.61%
jan 1, 1992
12.381 mln
-1.401 mln
-10.16%
jan 1, 1993
13.571 mln
+1.19 mln
9.61%
jan 1, 1994
7.162 mln
-6.409 mln
-47.22%
jan 1, 1995
6.849 mln
-312.799K
-4.37%
jan 1, 1996
0.0
-6.849 mln
-100.0%
jan 1, 1997
173.161K
+173.161K
%
jan 1, 1998
485.023K
+311.862K
180.1%
jan 1, 1999
3.683K
-481.341K
-99.24%
jan 1, 2000
0.0
-3.683K
-100.0%
jan 1, 2005
68.021K
+68.021K
%
jan 1, 2006
107.421K
+39.401K
57.92%
jan 1, 2007
6.452 mln
+6.344 mln
5.91K%
jan 1, 2008
8.914 mln
+2.462 mln
38.16%
jan 1, 2009
5.885 mln
-3.028 mln
-33.97%
jan 1, 2010
6.217 mln
+331.64K
5.64%
jan 1, 2011
10.521 mln
+4.304 mln
69.23%
jan 1, 2012
11.594 mln
+1.073 mln
10.2%
jan 1, 2013
8.022 mln
-3.573 mln
-30.81%
jan 1, 2014
5.716 mln
-2.305 mln
-28.74%
jan 1, 2015
4.719 mln
-997.968K
-17.46%
jan 1, 2016
0.0
-4.719 mln
-100.0%
Ranking of countries by current statistics by years


Comments: