29
/
en
AIzaSyAYiBZKx7MnpbEhh9jyipgxe19OcubqV5w
April 1, 2024
184782
Madagascar
MDG
true
2
1
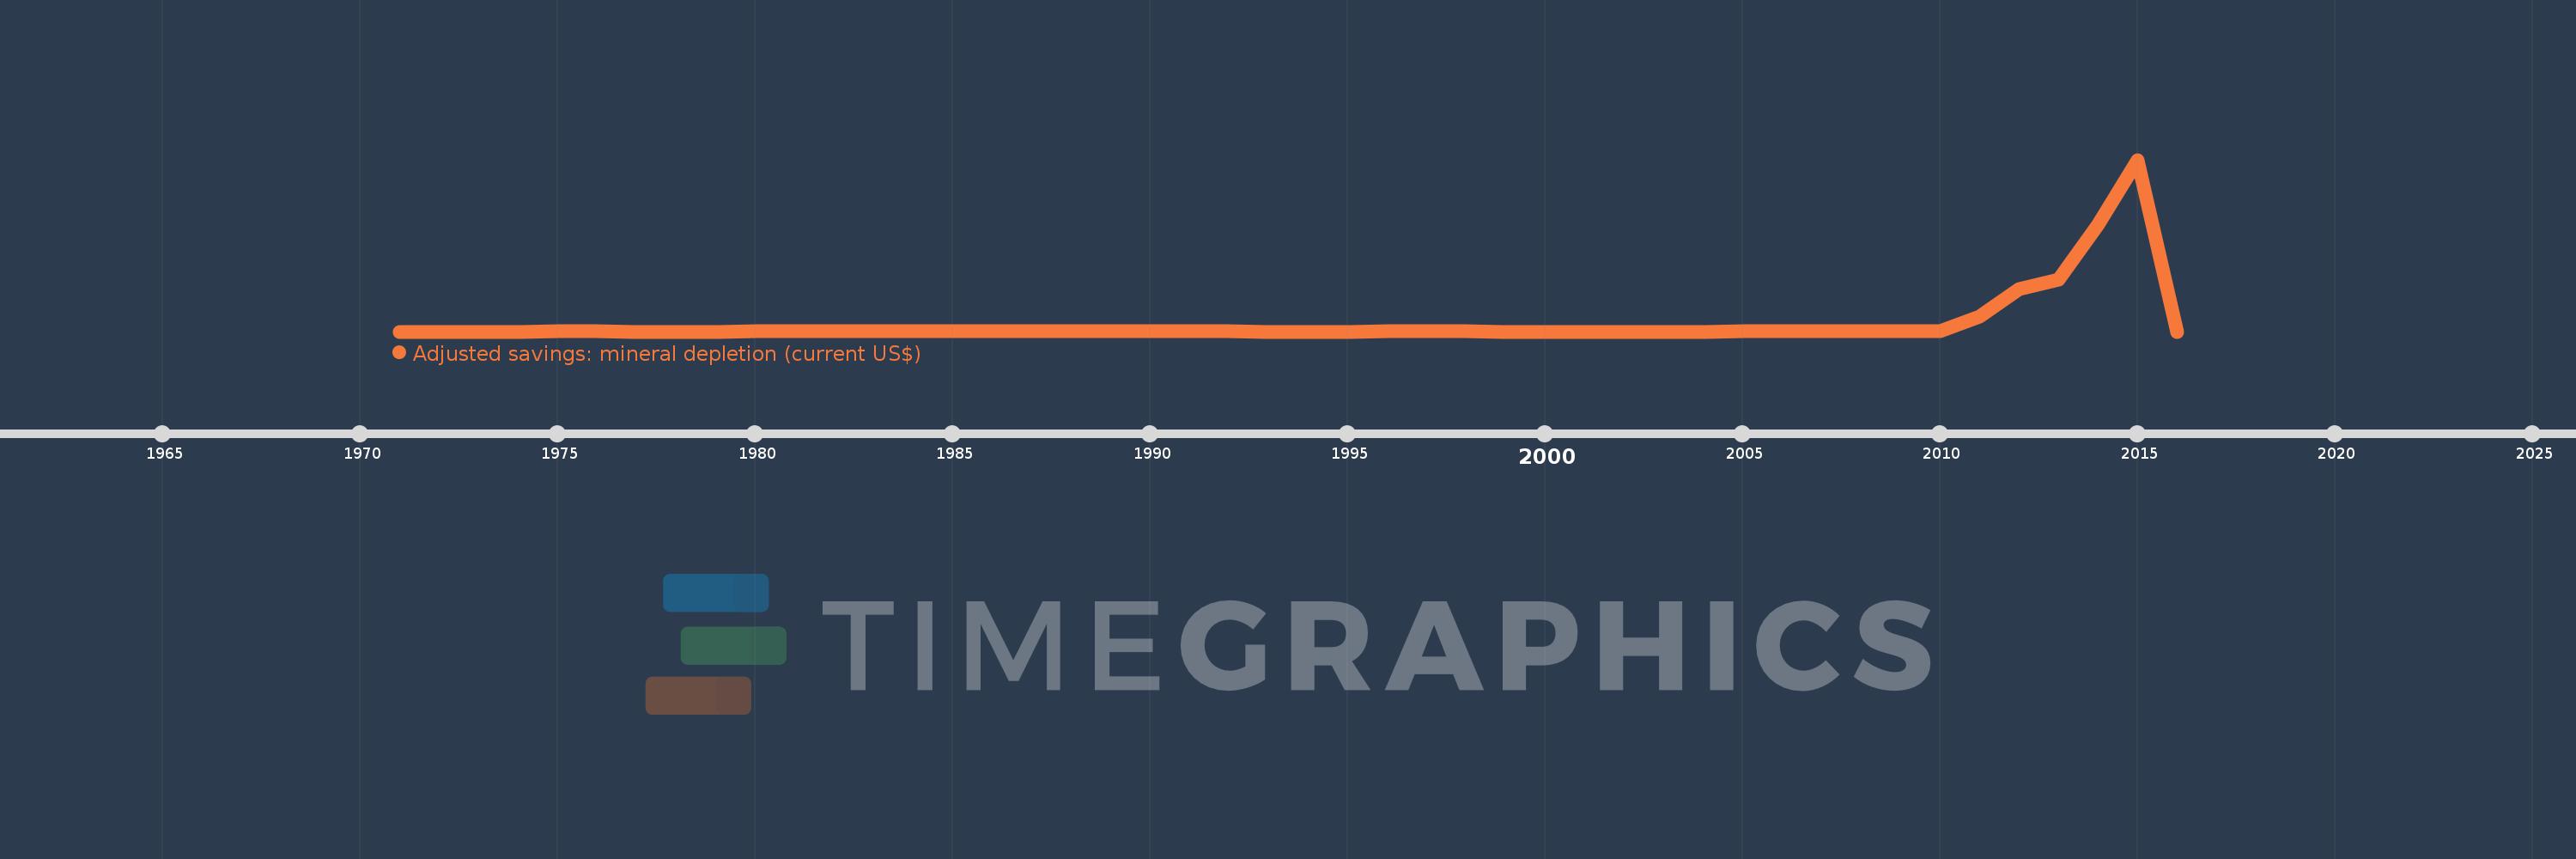
Adjusted savings: mineral depletion (current US$)
2016,2015,2014,2013,2012,2011,2010,2009,2008,2007,2006,2005,2004,2003,2002,2001,2000,1999,1998,1997,1996,1995,1994,1993,1992,1991,1990,1989,1988,1987,1986,1985,1984,1983,1982,1981,1980,1979,1978,1977,1976,1975,1974,1973,1972,1971
This statistics in other country:
AfghanistanAlbaniaAlgeriaAmerican SamoaAndorraAngolaAntigua and BarbudaArgentinaArmeniaArubaAustraliaAustriaAzerbaijanBahamas, TheBahrainBangladeshBarbadosBelarusBelgiumBelizeBeninBermudaBhutanBoliviaBosnia and HerzegovinaBotswanaBrazilBrunei DarussalamBulgariaBurkina FasoBurundiCabo VerdeCambodiaCameroonCanadaCayman IslandsCentral African RepublicChadChannel IslandsChileChinaColombiaComorosCongo, Dem. Rep.Congo, Rep.Costa RicaCote d'IvoireCroatiaCubaCuracaoCyprusCzech RepublicDenmarkDjiboutiDominicaDominican RepublicEcuadorEgypt, Arab Rep.El SalvadorEquatorial GuineaEritreaEstoniaEthiopiaFaroe IslandsFijiFinlandFranceFrench PolynesiaGabonGambia, TheGeorgiaGermanyGhanaGibraltarGreeceGreenlandGrenadaGuamGuatemalaGuineaGuinea-BissauGuyanaHaitiHondurasHong Kong SAR, ChinaHungaryIcelandIndiaIndonesiaIran, Islamic Rep.IraqIrelandIsle of ManIsraelItalyJamaicaJapanJordanKazakhstanKenyaKiribatiKorea, Dem. People’s Rep.Korea, Rep.KosovoKuwaitKyrgyz RepublicLao PDRLatviaLebanonLesothoLiberiaLibyaLiechtensteinLithuaniaLuxembourgMacao SAR, ChinaMacedonia, FYRMadagascarMalawiMalaysiaMaldivesMaliMaltaMarshall IslandsMauritaniaMauritiusMexicoMicronesia, Fed. Sts.MoldovaMonacoMongoliaMontenegroMoroccoMozambiqueMyanmarNamibiaNepalNetherlandsNew CaledoniaNew ZealandNicaraguaNigerNigeriaNorthern Mariana IslandsNorwayOmanPakistanPalauPanamaPapua New GuineaParaguayPeruPhilippinesPolandPortugalPuerto RicoQatarRomaniaRussian FederationRwandaSamoaSan MarinoSao Tome and PrincipeSaudi ArabiaSenegalSerbiaSeychellesSierra LeoneSingaporeSint Maarten (Dutch part)Slovak RepublicSloveniaSolomon IslandsSomaliaSouth AfricaSouth SudanSpainSri LankaSt. Kitts and NevisSt. LuciaSt. Martin (French part)St. Vincent and the GrenadinesSudanSurinameSwazilandSwedenSwitzerlandSyrian Arab RepublicTajikistanTanzaniaThailandTimor-LesteTogoTongaTrinidad and TobagoTunisiaTurkeyTurkmenistanTurks and Caicos IslandsTuvaluUgandaUkraineUnited Arab EmiratesUnited KingdomUnited StatesUruguayUzbekistanVanuatuVenezuela, RBVietnamVirgin Islands (U.S.)West Bank and GazaYemen, Rep.ZambiaZimbabwe Timeline:
This timeline shows a graph from 1971 to 2016 of Madagascar. No data until 1970. Number of actual observations by date: 46.
Source name:
World Development Indicators
Source organization:
World Bank staff estimates based on sources and methods in World Bank's "The Changing Wealth of Nations: Measuring Sustainable Development in the New Millennium" (2011).
Categories, topics:
Economy & Growth, Energy & Mining, Environment
Last updated:
apr 23, 2017
Indicators value changes by year
Maximum:
159.215 mln
jan 1, 2015
At the date of observation
Value
Absolute change
Change from previous value
jan 1, 1975
455.555
+455.555
%
jan 1, 1976
128.384
-327.171
-71.82%
jan 1, 1977
0.0
-128.384
-100.0%
jan 1, 1980
4.641K
+4.641K
%
jan 1, 1981
20.652K
+16.011K
345.02%
jan 1, 1982
3.031K
-17.621K
-85.32%
jan 1, 1983
5.795K
+2.764K
91.19%
jan 1, 1984
8.085K
+2.29K
39.51%
jan 1, 1985
5.632K
-2.453K
-30.34%
jan 1, 1986
5.201K
-430.931
-7.65%
jan 1, 1987
6.1K
+899.058
17.29%
jan 1, 1988
91.868K
+85.768K
1.41K%
jan 1, 1989
170.486K
+78.618K
85.58%
jan 1, 1990
68.413K
-102.073K
-59.87%
jan 1, 1991
39.378K
-29.035K
-42.44%
jan 1, 1992
28.808K
-10.57K
-26.84%
jan 1, 1993
0.0
-28.808K
-100.0%
jan 1, 1996
30.896K
+30.896K
%
jan 1, 1997
52.864K
+21.968K
71.1%
jan 1, 1998
748.746
-52.115K
-98.58%
jan 1, 1999
0.0
-748.746
-100.0%
jan 1, 2005
74.919K
+74.919K
%
jan 1, 2006
15.908K
-59.011K
-78.77%
jan 1, 2007
112.804K
+96.896K
609.1%
jan 1, 2008
4.786K
-108.018K
-95.76%
jan 1, 2009
518.326K
+513.54K
10.73K%
jan 1, 2010
229.929K
-288.397K
-55.64%
jan 1, 2011
13.891 mln
+13.661 mln
5.94K%
jan 1, 2012
39.499 mln
+25.609 mln
184.36%
jan 1, 2013
48.193 mln
+8.694 mln
22.01%
jan 1, 2014
99.218 mln
+51.024 mln
105.87%
jan 1, 2015
159.215 mln
+59.997 mln
60.47%
jan 1, 2016
0.0
-159.215 mln
-100.0%
Ranking of countries by current statistics by years


Comments: