29
/
en
AIzaSyAYiBZKx7MnpbEhh9jyipgxe19OcubqV5w
April 1, 2024
155546
Indonesia
IDN
true
2
1
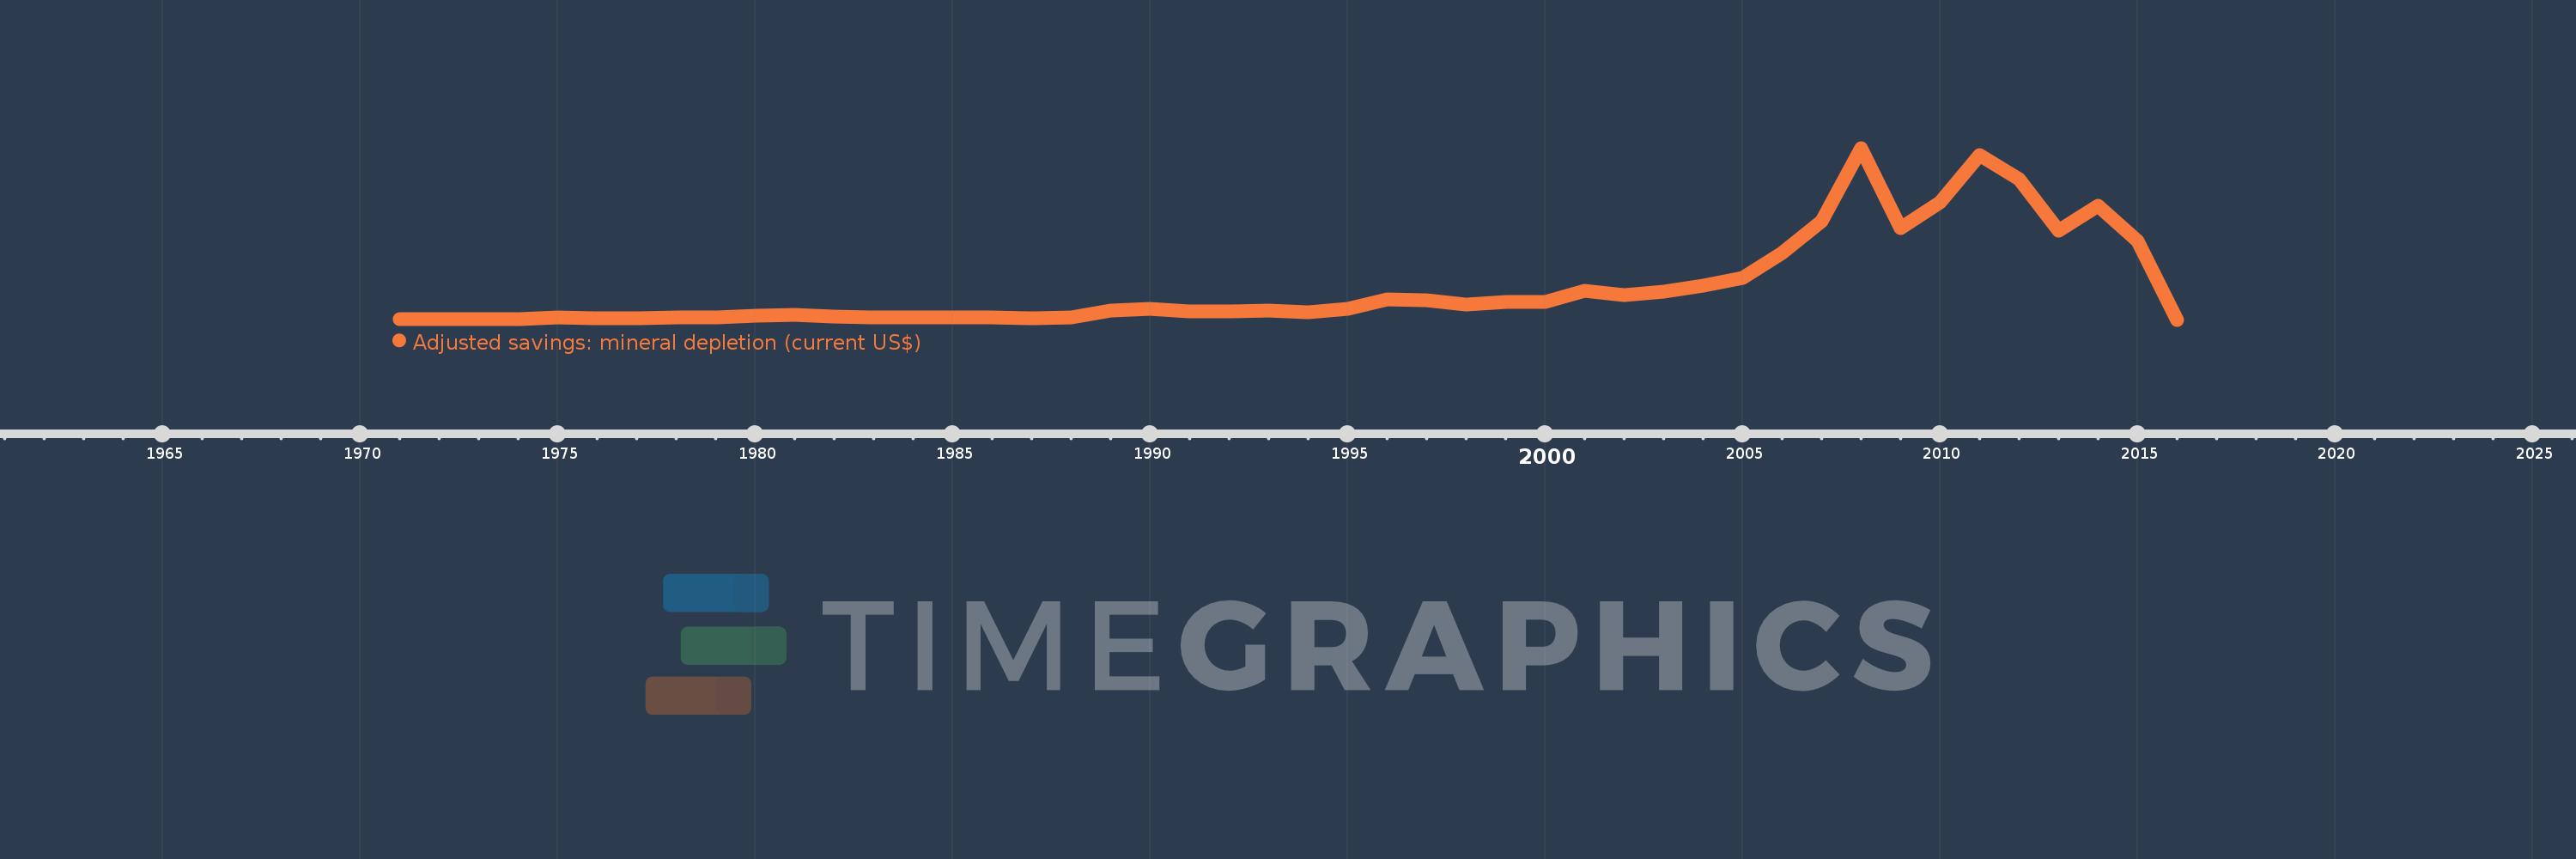
Adjusted savings: mineral depletion (current US$)
2016,2015,2014,2013,2012,2011,2010,2009,2008,2007,2006,2005,2004,2003,2002,2001,2000,1999,1998,1997,1996,1995,1994,1993,1992,1991,1990,1989,1988,1987,1986,1985,1984,1983,1982,1981,1980,1979,1978,1977,1976,1975,1974,1973,1972,1971
This statistics in other country:
AfghanistanAlbaniaAlgeriaAmerican SamoaAndorraAngolaAntigua and BarbudaArgentinaArmeniaArubaAustraliaAustriaAzerbaijanBahamas, TheBahrainBangladeshBarbadosBelarusBelgiumBelizeBeninBermudaBhutanBoliviaBosnia and HerzegovinaBotswanaBrazilBrunei DarussalamBulgariaBurkina FasoBurundiCabo VerdeCambodiaCameroonCanadaCayman IslandsCentral African RepublicChadChannel IslandsChileChinaColombiaComorosCongo, Dem. Rep.Congo, Rep.Costa RicaCote d'IvoireCroatiaCubaCuracaoCyprusCzech RepublicDenmarkDjiboutiDominicaDominican RepublicEcuadorEgypt, Arab Rep.El SalvadorEquatorial GuineaEritreaEstoniaEthiopiaFaroe IslandsFijiFinlandFranceFrench PolynesiaGabonGambia, TheGeorgiaGermanyGhanaGibraltarGreeceGreenlandGrenadaGuamGuatemalaGuineaGuinea-BissauGuyanaHaitiHondurasHong Kong SAR, ChinaHungaryIcelandIndiaIndonesiaIran, Islamic Rep.IraqIrelandIsle of ManIsraelItalyJamaicaJapanJordanKazakhstanKenyaKiribatiKorea, Dem. People’s Rep.Korea, Rep.KosovoKuwaitKyrgyz RepublicLao PDRLatviaLebanonLesothoLiberiaLibyaLiechtensteinLithuaniaLuxembourgMacao SAR, ChinaMacedonia, FYRMadagascarMalawiMalaysiaMaldivesMaliMaltaMarshall IslandsMauritaniaMauritiusMexicoMicronesia, Fed. Sts.MoldovaMonacoMongoliaMontenegroMoroccoMozambiqueMyanmarNamibiaNepalNetherlandsNew CaledoniaNew ZealandNicaraguaNigerNigeriaNorthern Mariana IslandsNorwayOmanPakistanPalauPanamaPapua New GuineaParaguayPeruPhilippinesPolandPortugalPuerto RicoQatarRomaniaRussian FederationRwandaSamoaSan MarinoSao Tome and PrincipeSaudi ArabiaSenegalSerbiaSeychellesSierra LeoneSingaporeSint Maarten (Dutch part)Slovak RepublicSloveniaSolomon IslandsSomaliaSouth AfricaSouth SudanSpainSri LankaSt. Kitts and NevisSt. LuciaSt. Martin (French part)St. Vincent and the GrenadinesSudanSurinameSwazilandSwedenSwitzerlandSyrian Arab RepublicTajikistanTanzaniaThailandTimor-LesteTogoTongaTrinidad and TobagoTunisiaTurkeyTurkmenistanTurks and Caicos IslandsTuvaluUgandaUkraineUnited Arab EmiratesUnited KingdomUnited StatesUruguayUzbekistanVanuatuVenezuela, RBVietnamVirgin Islands (U.S.)West Bank and GazaYemen, Rep.ZambiaZimbabwe Timeline:
This timeline shows a graph from 1971 to 2016 of Indonesia. No data until 1970. Number of actual observations by date: 46.
Source name:
World Development Indicators
Source organization:
World Bank staff estimates based on sources and methods in World Bank's "The Changing Wealth of Nations: Measuring Sustainable Development in the New Millennium" (2011).
Categories, topics:
Economy & Growth, Energy & Mining, Environment
Last updated:
apr 23, 2017
Indicators value changes by year
Maximum:
9.498 bln
jan 1, 2008
At the date of observation
Value
Absolute change
Change from previous value
jan 1, 1971
16.008 mln
+16.008 mln
0.0%
jan 1, 1972
19.442 mln
+3.434 mln
21.45%
jan 1, 1973
21.551 mln
+2.109 mln
10.85%
jan 1, 1974
55.274 mln
+33.723 mln
156.48%
jan 1, 1975
122.232 mln
+66.958 mln
121.14%
jan 1, 1976
66.95 mln
-55.281 mln
-45.23%
jan 1, 1977
79.839 mln
+12.889 mln
19.25%
jan 1, 1978
126.29 mln
+46.451 mln
58.18%
jan 1, 1979
143.061 mln
+16.77 mln
13.28%
jan 1, 1980
225.3 mln
+82.24 mln
57.49%
jan 1, 1981
262.786 mln
+37.486 mln
16.64%
jan 1, 1982
185.198 mln
-77.588 mln
-29.53%
jan 1, 1983
125.215 mln
-59.983 mln
-32.39%
jan 1, 1984
130.823 mln
+5.608 mln
4.48%
jan 1, 1985
134.594 mln
+3.771 mln
2.88%
jan 1, 1986
128.464 mln
-6.13 mln
-4.55%
jan 1, 1987
84.637 mln
-43.827 mln
-34.12%
jan 1, 1988
124.498 mln
+39.86 mln
47.1%
jan 1, 1989
516.507 mln
+392.01 mln
314.87%
jan 1, 1990
581.505 mln
+64.998 mln
12.58%
jan 1, 1991
439.766 mln
-141.739 mln
-24.37%
jan 1, 1992
455.662 mln
+15.895 mln
3.61%
jan 1, 1993
529.092 mln
+73.43 mln
16.12%
jan 1, 1994
418.035 mln
-111.057 mln
-20.99%
jan 1, 1995
587.557 mln
+169.522 mln
40.55%
jan 1, 1996
1.104 bln
+516.321 mln
87.88%
jan 1, 1997
1.088 bln
-16.07 mln
-1.46%
jan 1, 1998
857.571 mln
-230.236 mln
-21.17%
jan 1, 1999
959.924 mln
+102.352 mln
11.94%
jan 1, 2000
966.074 mln
+6.15 mln
0.64%
jan 1, 2001
1.623 bln
+656.825 mln
67.99%
jan 1, 2002
1.369 bln
-253.821 mln
-15.64%
jan 1, 2003
1.575 bln
+206.335 mln
15.07%
jan 1, 2004
1.873 bln
+297.812 mln
18.9%
jan 1, 2005
2.289 bln
+415.928 mln
22.2%
jan 1, 2006
3.671 bln
+1.382 bln
60.37%
jan 1, 2007
5.464 bln
+1.793 bln
48.83%
jan 1, 2008
9.498 bln
+4.035 bln
73.84%
jan 1, 2009
5.069 bln
-4.429 bln
-46.63%
jan 1, 2010
6.488 bln
+1.418 bln
27.98%
jan 1, 2011
9.083 bln
+2.595 bln
40.0%
jan 1, 2012
7.751 bln
-1.331 bln
-14.66%
jan 1, 2013
4.938 bln
-2.814 bln
-36.3%
jan 1, 2014
6.285 bln
+1.347 bln
27.29%
jan 1, 2015
4.348 bln
-1.937 bln
-30.82%
jan 1, 2016
0.0
-4.348 bln
-100.0%
Ranking of countries by current statistics by years


Comments: