29
/
en
AIzaSyAYiBZKx7MnpbEhh9jyipgxe19OcubqV5w
April 1, 2024
211306
Niger
NER
true
2
1
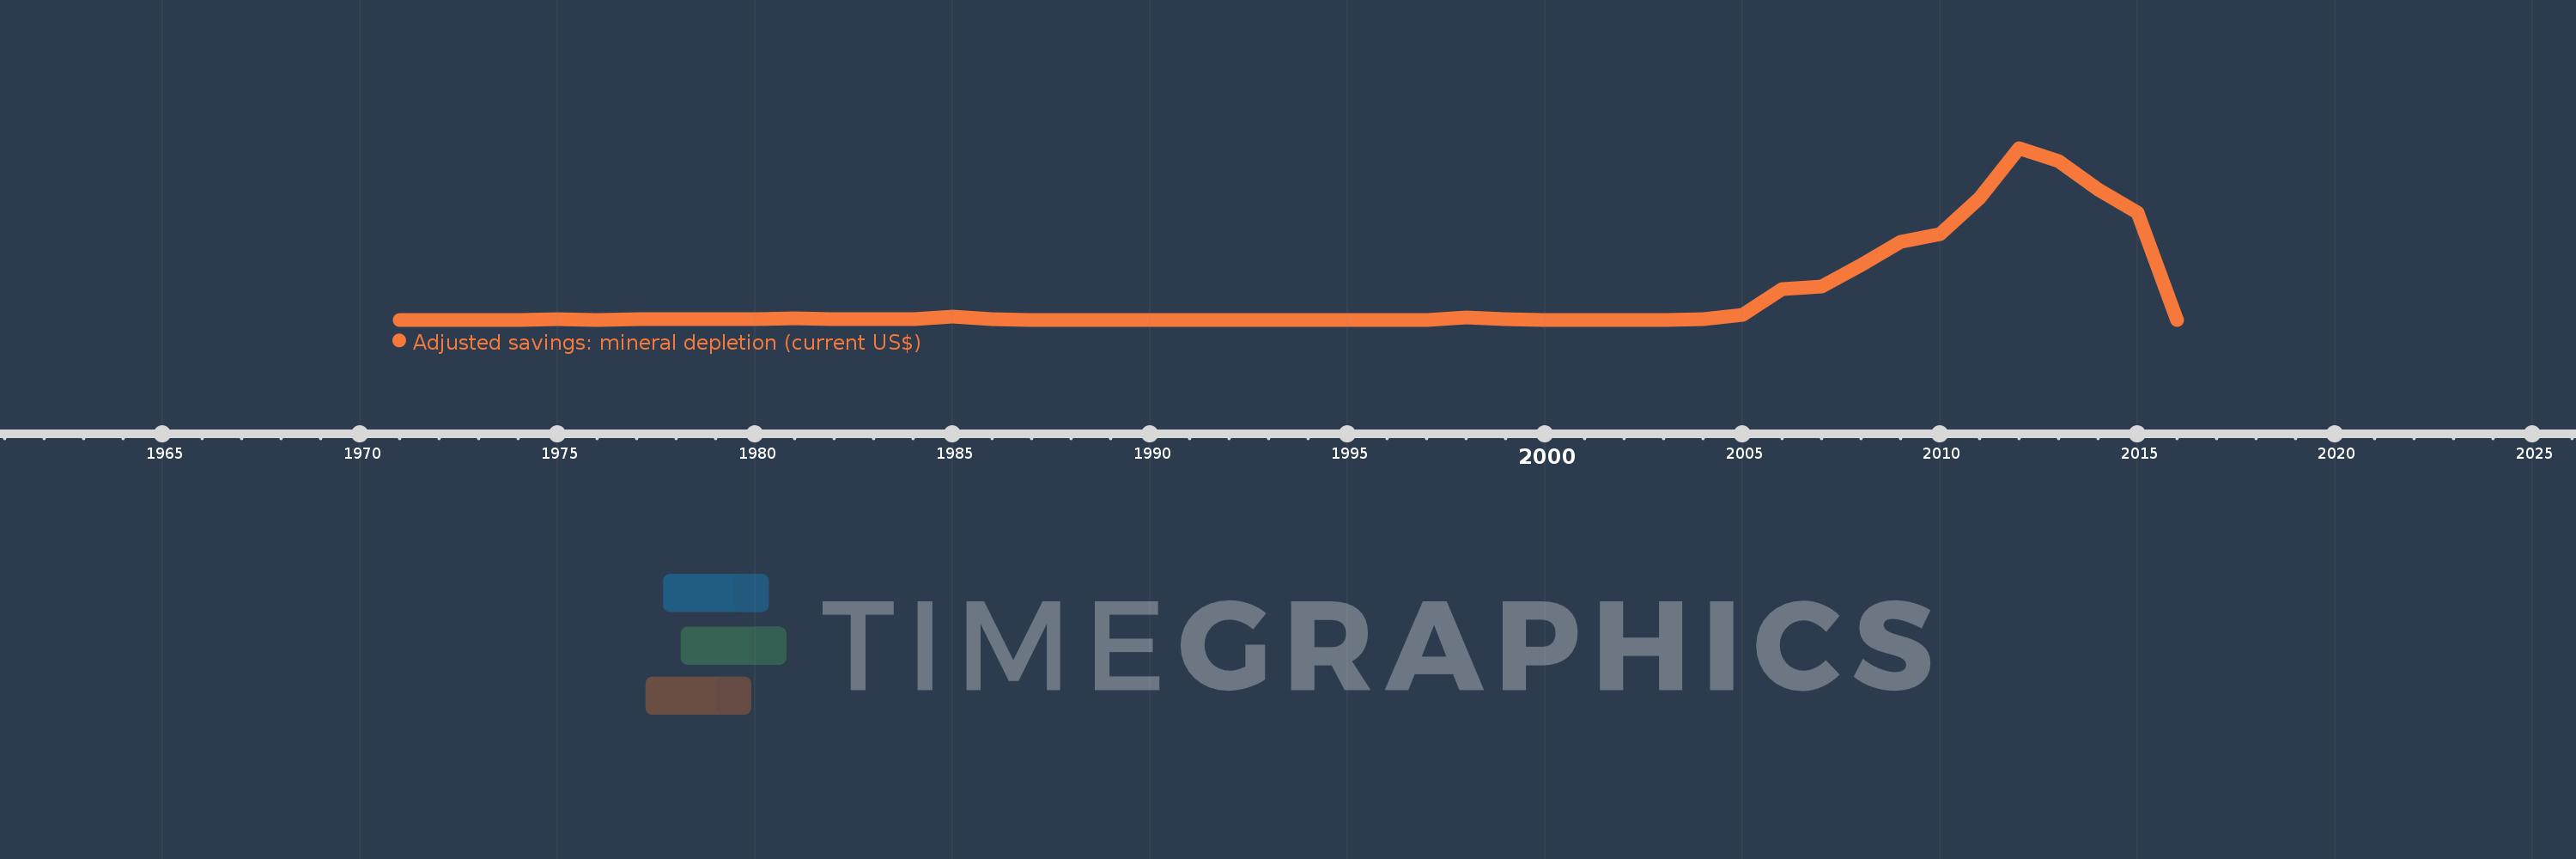
Adjusted savings: mineral depletion (current US$)
2016,2015,2014,2013,2012,2011,2010,2009,2008,2007,2006,2005,2004,2003,2002,2001,2000,1999,1998,1997,1996,1995,1994,1993,1992,1991,1990,1989,1988,1987,1986,1985,1984,1983,1982,1981,1980,1979,1978,1977,1976,1975,1974,1973,1972,1971
This statistics in other country:
AfghanistanAlbaniaAlgeriaAmerican SamoaAndorraAngolaAntigua and BarbudaArgentinaArmeniaArubaAustraliaAustriaAzerbaijanBahamas, TheBahrainBangladeshBarbadosBelarusBelgiumBelizeBeninBermudaBhutanBoliviaBosnia and HerzegovinaBotswanaBrazilBrunei DarussalamBulgariaBurkina FasoBurundiCabo VerdeCambodiaCameroonCanadaCayman IslandsCentral African RepublicChadChannel IslandsChileChinaColombiaComorosCongo, Dem. Rep.Congo, Rep.Costa RicaCote d'IvoireCroatiaCubaCuracaoCyprusCzech RepublicDenmarkDjiboutiDominicaDominican RepublicEcuadorEgypt, Arab Rep.El SalvadorEquatorial GuineaEritreaEstoniaEthiopiaFaroe IslandsFijiFinlandFranceFrench PolynesiaGabonGambia, TheGeorgiaGermanyGhanaGibraltarGreeceGreenlandGrenadaGuamGuatemalaGuineaGuinea-BissauGuyanaHaitiHondurasHong Kong SAR, ChinaHungaryIcelandIndiaIndonesiaIran, Islamic Rep.IraqIrelandIsle of ManIsraelItalyJamaicaJapanJordanKazakhstanKenyaKiribatiKorea, Dem. People’s Rep.Korea, Rep.KosovoKuwaitKyrgyz RepublicLao PDRLatviaLebanonLesothoLiberiaLibyaLiechtensteinLithuaniaLuxembourgMacao SAR, ChinaMacedonia, FYRMadagascarMalawiMalaysiaMaldivesMaliMaltaMarshall IslandsMauritaniaMauritiusMexicoMicronesia, Fed. Sts.MoldovaMonacoMongoliaMontenegroMoroccoMozambiqueMyanmarNamibiaNepalNetherlandsNew CaledoniaNew ZealandNicaraguaNigerNigeriaNorthern Mariana IslandsNorwayOmanPakistanPalauPanamaPapua New GuineaParaguayPeruPhilippinesPolandPortugalPuerto RicoQatarRomaniaRussian FederationRwandaSamoaSan MarinoSao Tome and PrincipeSaudi ArabiaSenegalSerbiaSeychellesSierra LeoneSingaporeSint Maarten (Dutch part)Slovak RepublicSloveniaSolomon IslandsSomaliaSouth AfricaSouth SudanSpainSri LankaSt. Kitts and NevisSt. LuciaSt. Martin (French part)St. Vincent and the GrenadinesSudanSurinameSwazilandSwedenSwitzerlandSyrian Arab RepublicTajikistanTanzaniaThailandTimor-LesteTogoTongaTrinidad and TobagoTunisiaTurkeyTurkmenistanTurks and Caicos IslandsTuvaluUgandaUkraineUnited Arab EmiratesUnited KingdomUnited StatesUruguayUzbekistanVanuatuVenezuela, RBVietnamVirgin Islands (U.S.)West Bank and GazaYemen, Rep.ZambiaZimbabwe Timeline:
This timeline shows a graph from 1971 to 2016 of Niger. No data until 1970. Number of actual observations by date: 46.
Source name:
World Development Indicators
Source organization:
World Bank staff estimates based on sources and methods in World Bank's "The Changing Wealth of Nations: Measuring Sustainable Development in the New Millennium" (2011).
Categories, topics:
Economy & Growth, Energy & Mining, Environment
Last updated:
apr 23, 2017
Indicators value changes by year
Maximum:
56.799 mln
jan 1, 2012
At the date of observation
Value
Absolute change
Change from previous value
jan 1, 1971
16.653K
+16.653K
0.0%
jan 1, 1972
0.0
-16.653K
-100.0%
jan 1, 1974
18.087K
+18.087K
%
jan 1, 1975
140.341K
+122.253K
675.9%
jan 1, 1976
44.304K
-96.037K
-68.43%
jan 1, 1977
75.82K
+31.516K
71.14%
jan 1, 1978
211.018K
+135.199K
178.32%
jan 1, 1979
257.414K
+46.395K
21.99%
jan 1, 1980
335.775K
+78.362K
30.44%
jan 1, 1981
353.819K
+18.043K
5.37%
jan 1, 1982
234.592K
-119.227K
-33.7%
jan 1, 1983
188.086K
-46.505K
-19.82%
jan 1, 1984
211.645K
+23.559K
12.53%
jan 1, 1985
927.656K
+716.011K
338.31%
jan 1, 1986
156.303K
-771.353K
-83.15%
jan 1, 1987
0.0
-156.303K
-100.0%
jan 1, 1998
830.527K
+830.527K
%
jan 1, 1999
245.503K
-585.024K
-70.44%
jan 1, 2000
0.0
-245.503K
-100.0%
jan 1, 2001
2.039K
+2.039K
%
jan 1, 2002
3.789K
+1.75K
85.8%
jan 1, 2003
41.438K
+37.649K
993.7%
jan 1, 2004
58.798K
+17.36K
41.89%
jan 1, 2005
1.723 mln
+1.664 mln
2.83K%
jan 1, 2006
10.057 mln
+8.334 mln
483.63%
jan 1, 2007
11.002 mln
+944.815K
9.39%
jan 1, 2008
18.033 mln
+7.031 mln
63.9%
jan 1, 2009
25.784 mln
+7.752 mln
42.99%
jan 1, 2010
28.328 mln
+2.543 mln
9.86%
jan 1, 2011
40.275 mln
+11.948 mln
42.18%
jan 1, 2012
56.799 mln
+16.524 mln
41.03%
jan 1, 2013
52.486 mln
-4.313 mln
-7.59%
jan 1, 2014
43.223 mln
-9.263 mln
-17.65%
jan 1, 2015
35.332 mln
-7.891 mln
-18.26%
jan 1, 2016
0.0
-35.332 mln
-100.0%
Ranking of countries by current statistics by years


Comments: