29
/
en
AIzaSyAYiBZKx7MnpbEhh9jyipgxe19OcubqV5w
April 1, 2024
86784
Bolivia
BOL
true
2
1
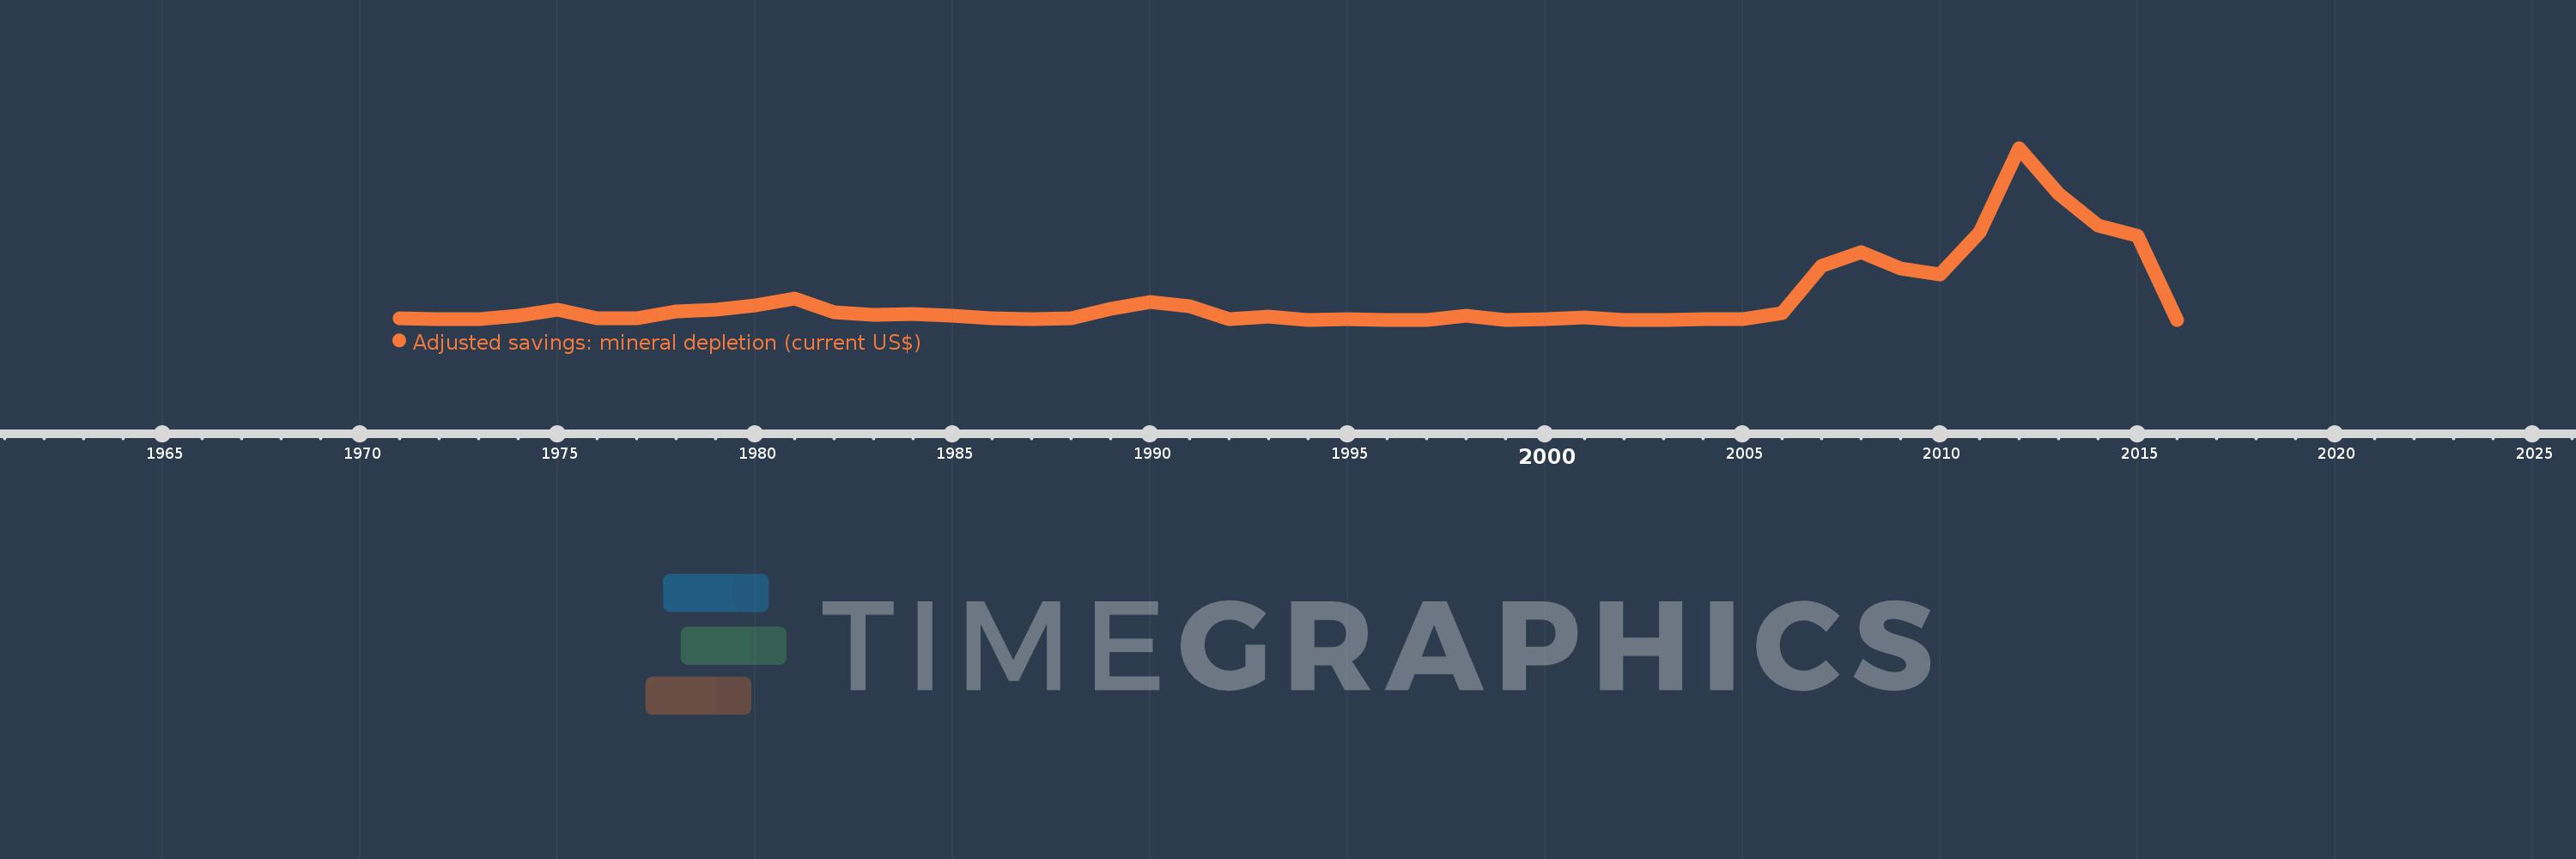
Adjusted savings: mineral depletion (current US$)
2016,2015,2014,2013,2012,2011,2010,2009,2008,2007,2006,2005,2004,2003,2002,2001,2000,1999,1998,1997,1996,1995,1994,1993,1992,1991,1990,1989,1988,1987,1986,1985,1984,1983,1982,1981,1980,1979,1978,1977,1976,1975,1974,1973,1972,1971
This statistics in other country:
AfghanistanAlbaniaAlgeriaAmerican SamoaAndorraAngolaAntigua and BarbudaArgentinaArmeniaArubaAustraliaAustriaAzerbaijanBahamas, TheBahrainBangladeshBarbadosBelarusBelgiumBelizeBeninBermudaBhutanBoliviaBosnia and HerzegovinaBotswanaBrazilBrunei DarussalamBulgariaBurkina FasoBurundiCabo VerdeCambodiaCameroonCanadaCayman IslandsCentral African RepublicChadChannel IslandsChileChinaColombiaComorosCongo, Dem. Rep.Congo, Rep.Costa RicaCote d'IvoireCroatiaCubaCuracaoCyprusCzech RepublicDenmarkDjiboutiDominicaDominican RepublicEcuadorEgypt, Arab Rep.El SalvadorEquatorial GuineaEritreaEstoniaEthiopiaFaroe IslandsFijiFinlandFranceFrench PolynesiaGabonGambia, TheGeorgiaGermanyGhanaGibraltarGreeceGreenlandGrenadaGuamGuatemalaGuineaGuinea-BissauGuyanaHaitiHondurasHong Kong SAR, ChinaHungaryIcelandIndiaIndonesiaIran, Islamic Rep.IraqIrelandIsle of ManIsraelItalyJamaicaJapanJordanKazakhstanKenyaKiribatiKorea, Dem. People’s Rep.Korea, Rep.KosovoKuwaitKyrgyz RepublicLao PDRLatviaLebanonLesothoLiberiaLibyaLiechtensteinLithuaniaLuxembourgMacao SAR, ChinaMacedonia, FYRMadagascarMalawiMalaysiaMaldivesMaliMaltaMarshall IslandsMauritaniaMauritiusMexicoMicronesia, Fed. Sts.MoldovaMonacoMongoliaMontenegroMoroccoMozambiqueMyanmarNamibiaNepalNetherlandsNew CaledoniaNew ZealandNicaraguaNigerNigeriaNorthern Mariana IslandsNorwayOmanPakistanPalauPanamaPapua New GuineaParaguayPeruPhilippinesPolandPortugalPuerto RicoQatarRomaniaRussian FederationRwandaSamoaSan MarinoSao Tome and PrincipeSaudi ArabiaSenegalSerbiaSeychellesSierra LeoneSingaporeSint Maarten (Dutch part)Slovak RepublicSloveniaSolomon IslandsSomaliaSouth AfricaSouth SudanSpainSri LankaSt. Kitts and NevisSt. LuciaSt. Martin (French part)St. Vincent and the GrenadinesSudanSurinameSwazilandSwedenSwitzerlandSyrian Arab RepublicTajikistanTanzaniaThailandTimor-LesteTogoTongaTrinidad and TobagoTunisiaTurkeyTurkmenistanTurks and Caicos IslandsTuvaluUgandaUkraineUnited Arab EmiratesUnited KingdomUnited StatesUruguayUzbekistanVanuatuVenezuela, RBVietnamVirgin Islands (U.S.)West Bank and GazaYemen, Rep.ZambiaZimbabwe Timeline:
This timeline shows a graph from 1971 to 2016 of Bolivia. No data until 1970. Number of actual observations by date: 46.
Source name:
World Development Indicators
Source organization:
World Bank staff estimates based on sources and methods in World Bank's "The Changing Wealth of Nations: Measuring Sustainable Development in the New Millennium" (2011).
Categories, topics:
Economy & Growth, Energy & Mining, Environment
Last updated:
apr 23, 2017
Indicators value changes by year
Maximum:
1.036 bln
jan 1, 2012
At the date of observation
Value
Absolute change
Change from previous value
jan 1, 1971
6.397 mln
+6.397 mln
0.0%
jan 1, 1972
3.015 mln
-3.382 mln
-52.87%
jan 1, 1973
4.222 mln
+1.207 mln
40.03%
jan 1, 1974
24.924 mln
+20.702 mln
490.35%
jan 1, 1975
59.935 mln
+35.012 mln
140.48%
jan 1, 1976
9.623 mln
-50.312 mln
-83.94%
jan 1, 1977
8.694 mln
-929.583K
-9.66%
jan 1, 1978
51.819 mln
+43.126 mln
496.06%
jan 1, 1979
60.453 mln
+8.634 mln
16.66%
jan 1, 1980
85.337 mln
+24.885 mln
41.16%
jan 1, 1981
125.883 mln
+40.545 mln
47.51%
jan 1, 1982
45.494 mln
-80.389 mln
-63.86%
jan 1, 1983
29.672 mln
-15.822 mln
-34.78%
jan 1, 1984
34.241 mln
+4.569 mln
15.4%
jan 1, 1985
24.958 mln
-9.283 mln
-27.11%
jan 1, 1986
11.339 mln
-13.619 mln
-54.57%
jan 1, 1987
1.398 mln
-9.942 mln
-87.68%
jan 1, 1988
9.149 mln
+7.752 mln
554.68%
jan 1, 1989
66.537 mln
+57.388 mln
627.23%
jan 1, 1990
106.088 mln
+39.55 mln
59.44%
jan 1, 1991
83.245 mln
-22.843 mln
-21.53%
jan 1, 1992
6.192 mln
-77.053 mln
-92.56%
jan 1, 1993
18.437 mln
+12.245 mln
197.74%
jan 1, 1994
279.051K
-18.158 mln
-98.49%
jan 1, 1995
3.119 mln
+2.839 mln
1.02K%
jan 1, 1996
321.784K
-2.797 mln
-89.68%
jan 1, 1997
310.861K
-10.922K
-3.39%
jan 1, 1998
25.188 mln
+24.877 mln
8.0K%
jan 1, 1999
0.0
-25.188 mln
-100.0%
jan 1, 2000
3.702 mln
+3.702 mln
%
jan 1, 2001
11.401 mln
+7.699 mln
208.0%
jan 1, 2002
0.0
-11.401 mln
-100.0%
jan 1, 2004
1.591 mln
+1.591 mln
%
jan 1, 2005
5.634 mln
+4.042 mln
254.01%
jan 1, 2006
39.034 mln
+33.401 mln
592.87%
jan 1, 2007
323.575 mln
+284.54 mln
728.95%
jan 1, 2008
406.616 mln
+83.041 mln
25.66%
jan 1, 2009
311.489 mln
-95.127 mln
-23.39%
jan 1, 2010
275.408 mln
-36.081 mln
-11.58%
jan 1, 2011
524.227 mln
+248.819 mln
90.35%
jan 1, 2012
1.036 bln
+511.592 mln
97.59%
jan 1, 2013
761.655 mln
-274.164 mln
-26.47%
jan 1, 2014
566.591 mln
-195.064 mln
-25.61%
jan 1, 2015
506.012 mln
-60.579 mln
-10.69%
jan 1, 2016
0.0
-506.012 mln
-100.0%
Ranking of countries by current statistics by years


Comments: