29
/
en
AIzaSyAYiBZKx7MnpbEhh9jyipgxe19OcubqV5w
April 1, 2024
235318
Senegal
SEN
true
2
1
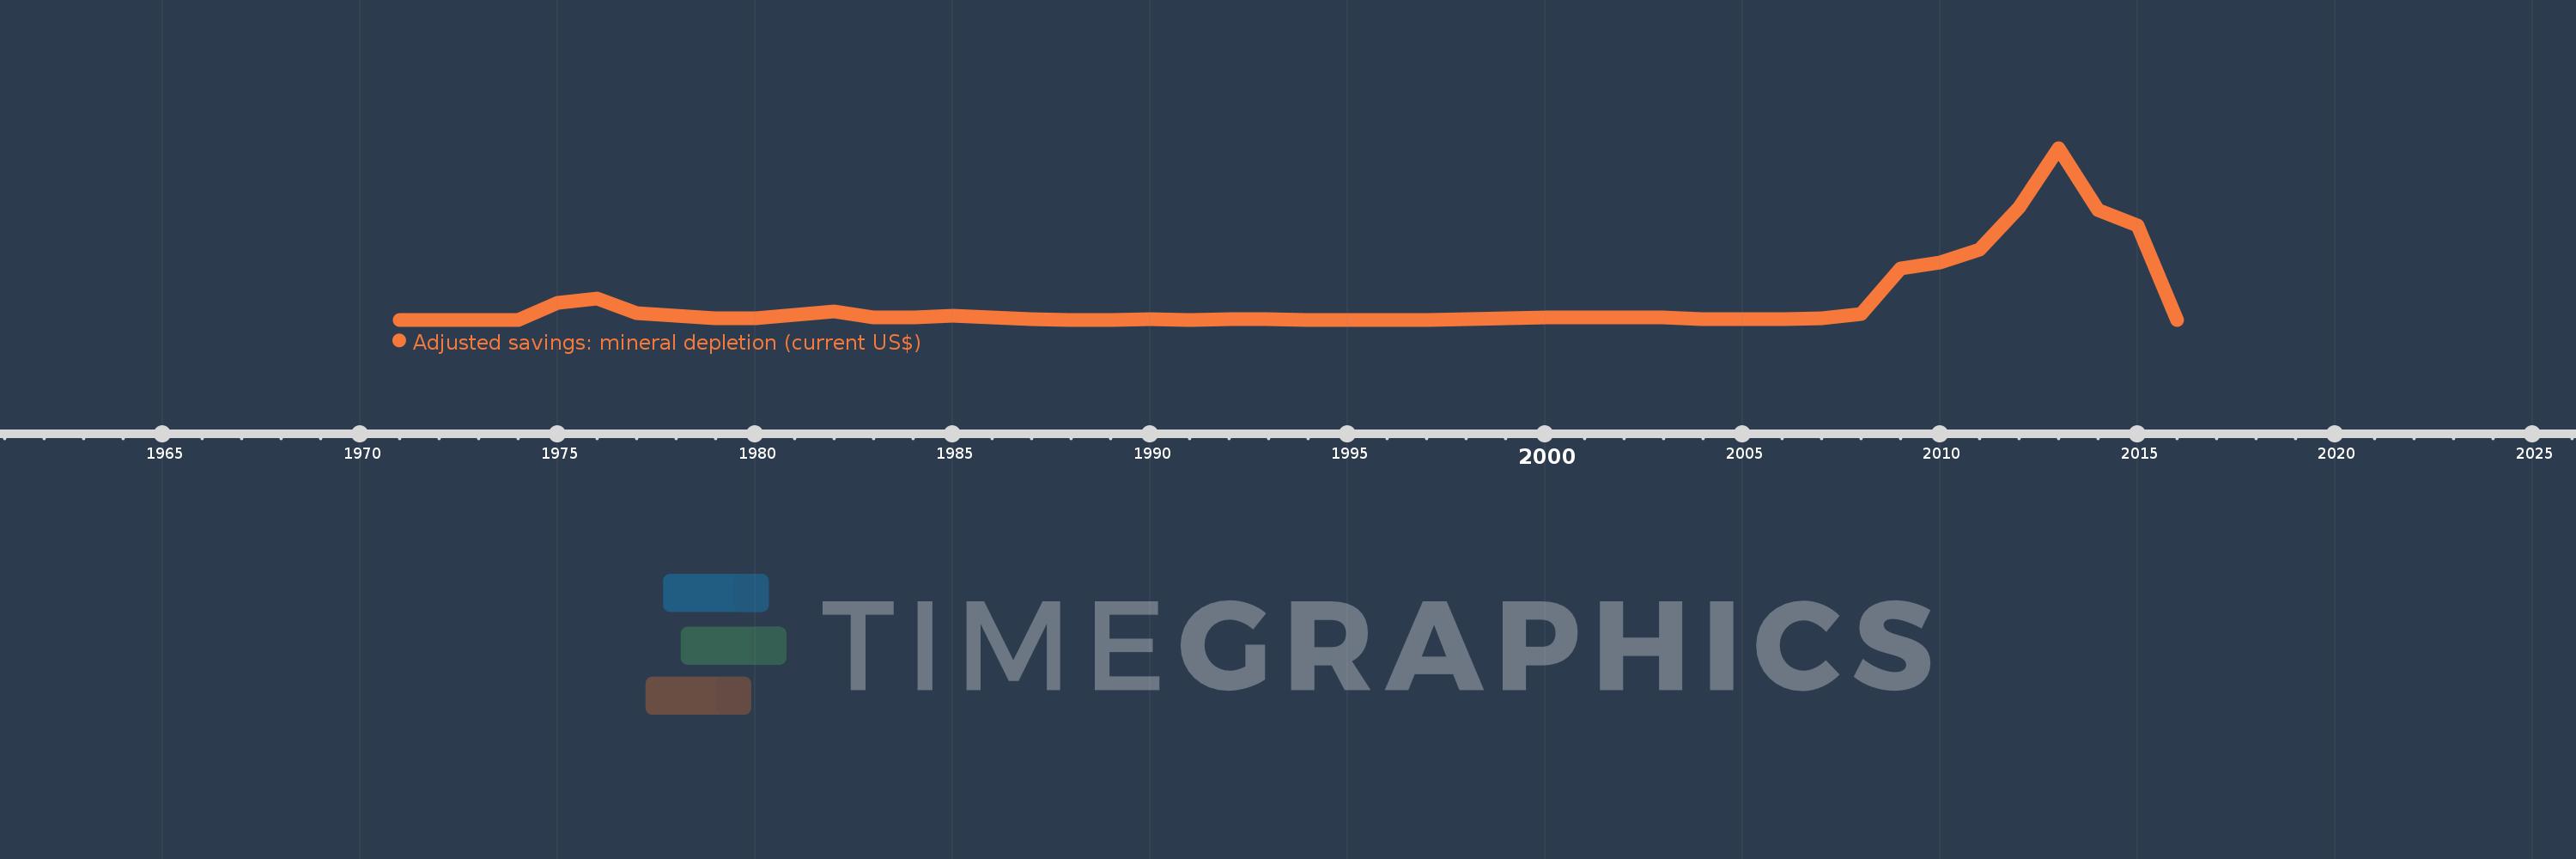
Adjusted savings: mineral depletion (current US$)
2016,2015,2014,2013,2012,2011,2010,2009,2008,2007,2006,2005,2004,2003,2002,2001,2000,1999,1998,1997,1996,1995,1994,1993,1992,1991,1990,1989,1988,1987,1986,1985,1984,1983,1982,1981,1980,1979,1978,1977,1976,1975,1974,1973,1972,1971
This statistics in other country:
AfghanistanAlbaniaAlgeriaAmerican SamoaAndorraAngolaAntigua and BarbudaArgentinaArmeniaArubaAustraliaAustriaAzerbaijanBahamas, TheBahrainBangladeshBarbadosBelarusBelgiumBelizeBeninBermudaBhutanBoliviaBosnia and HerzegovinaBotswanaBrazilBrunei DarussalamBulgariaBurkina FasoBurundiCabo VerdeCambodiaCameroonCanadaCayman IslandsCentral African RepublicChadChannel IslandsChileChinaColombiaComorosCongo, Dem. Rep.Congo, Rep.Costa RicaCote d'IvoireCroatiaCubaCuracaoCyprusCzech RepublicDenmarkDjiboutiDominicaDominican RepublicEcuadorEgypt, Arab Rep.El SalvadorEquatorial GuineaEritreaEstoniaEthiopiaFaroe IslandsFijiFinlandFranceFrench PolynesiaGabonGambia, TheGeorgiaGermanyGhanaGibraltarGreeceGreenlandGrenadaGuamGuatemalaGuineaGuinea-BissauGuyanaHaitiHondurasHong Kong SAR, ChinaHungaryIcelandIndiaIndonesiaIran, Islamic Rep.IraqIrelandIsle of ManIsraelItalyJamaicaJapanJordanKazakhstanKenyaKiribatiKorea, Dem. People’s Rep.Korea, Rep.KosovoKuwaitKyrgyz RepublicLao PDRLatviaLebanonLesothoLiberiaLibyaLiechtensteinLithuaniaLuxembourgMacao SAR, ChinaMacedonia, FYRMadagascarMalawiMalaysiaMaldivesMaliMaltaMarshall IslandsMauritaniaMauritiusMexicoMicronesia, Fed. Sts.MoldovaMonacoMongoliaMontenegroMoroccoMozambiqueMyanmarNamibiaNepalNetherlandsNew CaledoniaNew ZealandNicaraguaNigerNigeriaNorthern Mariana IslandsNorwayOmanPakistanPalauPanamaPapua New GuineaParaguayPeruPhilippinesPolandPortugalPuerto RicoQatarRomaniaRussian FederationRwandaSamoaSan MarinoSao Tome and PrincipeSaudi ArabiaSenegalSerbiaSeychellesSierra LeoneSingaporeSint Maarten (Dutch part)Slovak RepublicSloveniaSolomon IslandsSomaliaSouth AfricaSouth SudanSpainSri LankaSt. Kitts and NevisSt. LuciaSt. Martin (French part)St. Vincent and the GrenadinesSudanSurinameSwazilandSwedenSwitzerlandSyrian Arab RepublicTajikistanTanzaniaThailandTimor-LesteTogoTongaTrinidad and TobagoTunisiaTurkeyTurkmenistanTurks and Caicos IslandsTuvaluUgandaUkraineUnited Arab EmiratesUnited KingdomUnited StatesUruguayUzbekistanVanuatuVenezuela, RBVietnamVirgin Islands (U.S.)West Bank and GazaYemen, Rep.ZambiaZimbabwe Timeline:
This timeline shows a graph from 1971 to 2016 of Senegal. No data until 1970. Number of actual observations by date: 46.
Source name:
World Development Indicators
Source organization:
World Bank staff estimates based on sources and methods in World Bank's "The Changing Wealth of Nations: Measuring Sustainable Development in the New Millennium" (2011).
Categories, topics:
Economy & Growth, Energy & Mining, Environment
Last updated:
apr 23, 2017
Indicators value changes by year
Maximum:
309.264 mln
jan 1, 2013
At the date of observation
Value
Absolute change
Change from previous value
jan 1, 1975
30.193 mln
+30.193 mln
%
jan 1, 1976
38.937 mln
+8.744 mln
28.96%
jan 1, 1977
12.027 mln
-26.91 mln
-69.11%
jan 1, 1978
6.799 mln
-5.229 mln
-43.47%
jan 1, 1979
2.218 mln
-4.581 mln
-67.38%
jan 1, 1980
2.742 mln
+524.714K
23.66%
jan 1, 1981
9.509 mln
+6.767 mln
246.74%
jan 1, 1982
14.931 mln
+5.422 mln
57.02%
jan 1, 1983
4.869 mln
-10.062 mln
-67.39%
jan 1, 1984
3.654 mln
-1.215 mln
-24.95%
jan 1, 1985
7.295 mln
+3.641 mln
99.63%
jan 1, 1986
3.598 mln
-3.697 mln
-50.68%
jan 1, 1987
344.633K
-3.253 mln
-90.42%
jan 1, 1988
0.0
-344.633K
-100.0%
jan 1, 1990
1.634 mln
+1.634 mln
%
jan 1, 1991
0.0
-1.634 mln
-100.0%
jan 1, 1992
1.676 mln
+1.676 mln
%
jan 1, 1993
665.466K
-1.011 mln
-60.31%
jan 1, 1994
0.0
-665.466K
-100.0%
jan 1, 1998
456.79K
+456.79K
%
jan 1, 1999
2.239 mln
+1.782 mln
390.14%
jan 1, 2000
4.834 mln
+2.595 mln
115.92%
jan 1, 2001
4.876 mln
+41.34K
0.86%
jan 1, 2002
4.217 mln
-658.432K
-13.5%
jan 1, 2003
3.568 mln
-649.521K
-15.4%
jan 1, 2004
1.078 mln
-2.49 mln
-69.78%
jan 1, 2005
1.512 mln
+433.616K
40.23%
jan 1, 2006
1.216 mln
-295.482K
-19.55%
jan 1, 2007
2.524 mln
+1.308 mln
107.58%
jan 1, 2008
10.544 mln
+8.02 mln
317.69%
jan 1, 2009
91.685 mln
+81.141 mln
769.55%
jan 1, 2010
103.582 mln
+11.897 mln
12.98%
jan 1, 2011
126.05 mln
+22.468 mln
21.69%
jan 1, 2012
201.423 mln
+75.373 mln
59.8%
jan 1, 2013
309.264 mln
+107.841 mln
53.54%
jan 1, 2014
198.136 mln
-111.129 mln
-35.93%
jan 1, 2015
170.318 mln
-27.818 mln
-14.04%
jan 1, 2016
0.0
-170.318 mln
-100.0%
Ranking of countries by current statistics by years


Comments: