29
/
en
AIzaSyAYiBZKx7MnpbEhh9jyipgxe19OcubqV5w
April 1, 2024
237641
Serbia
SRB
true
2
1
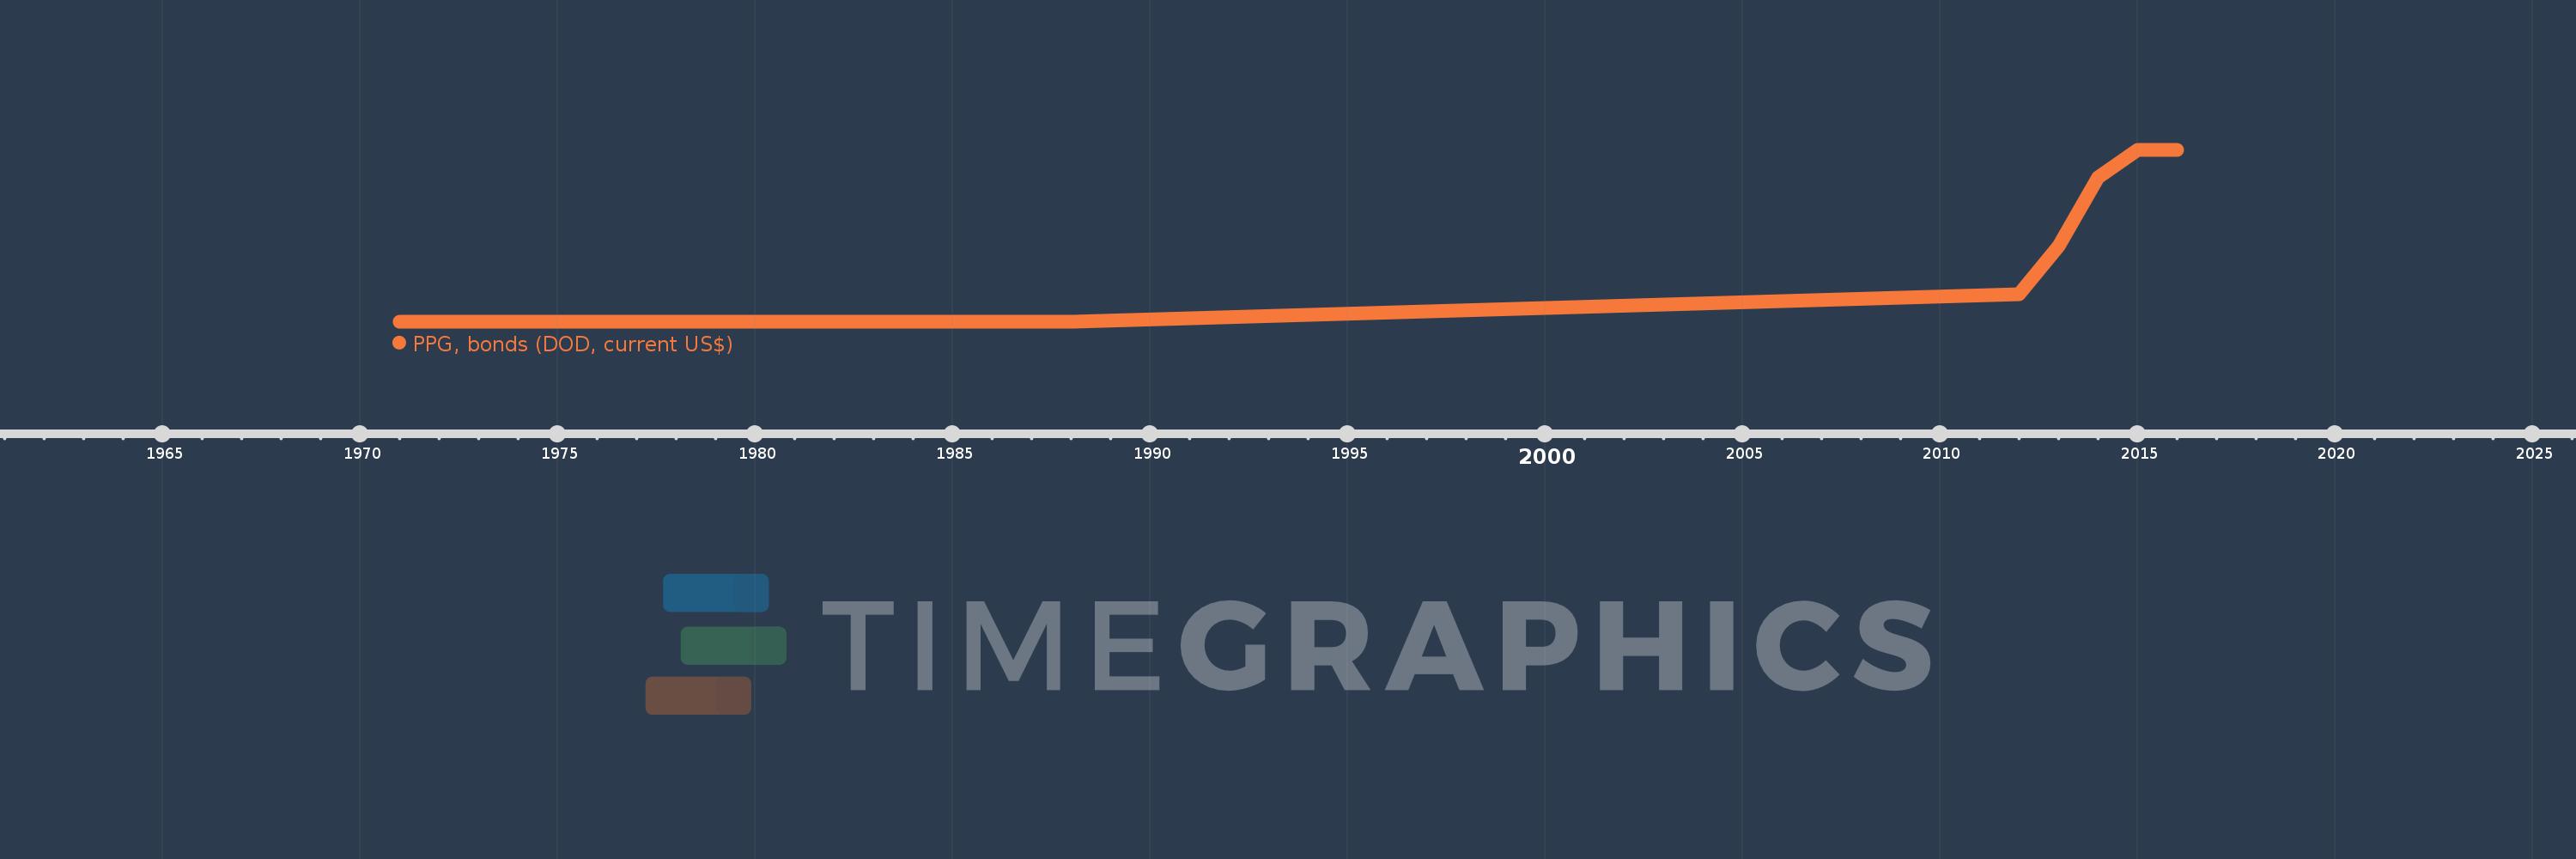
PPG, bonds (DOD, current US$)
2016,2015,2014,2013,2012,1988,1987,1986,1985,1984,1983,1982,1981,1980,1979,1978,1977,1976,1975,1974,1973,1972,1971
This statistics in other country:
Timeline:
This timeline shows a graph from 1971 to 2016 of Serbia. No data until 1970. Number of actual observations by date: 23.
Source name:
World Development Indicators
Source organization:
World Bank, International Debt Statistics.
Categories, topics:
External Debt
Last updated:
apr 23, 2017
Indicators value changes by year
Maximum:
6.25 bln
jan 1, 2015
At the date of observation
Value
Absolute change
Change from previous value
jan 1, 1971
20.749 mln
+20.749 mln
0.0%
jan 1, 1972
20.129 mln
-620.0K
-2.99%
jan 1, 1973
19.491 mln
-638.0K
-3.17%
jan 1, 1974
19.135 mln
-356.0K
-1.83%
jan 1, 1975
19.003 mln
-132.0K
-0.69%
jan 1, 1976
18.109 mln
-894.0K
-4.7%
jan 1, 1977
17.477 mln
-632.0K
-3.49%
jan 1, 1978
15.906 mln
-1.571 mln
-8.99%
jan 1, 1979
14.174 mln
-1.732 mln
-10.89%
jan 1, 1980
11.881 mln
-2.293 mln
-16.18%
jan 1, 1981
9.675 mln
-2.206 mln
-18.57%
jan 1, 1982
7.876 mln
-1.799 mln
-18.59%
jan 1, 1983
6.474 mln
-1.402 mln
-17.8%
jan 1, 1984
5.072 mln
-1.402 mln
-21.66%
jan 1, 1985
3.67 mln
-1.402 mln
-27.64%
jan 1, 1986
2.268 mln
-1.402 mln
-38.2%
jan 1, 1987
866.0K
-1.402 mln
-61.82%
jan 1, 1988
0.0
-866.0K
-100.0%
jan 1, 2012
1000.0 mln
+1000.0 mln
%
jan 1, 2013
2.75 bln
+1.75 bln
175.0%
jan 1, 2014
5.25 bln
+2.5 bln
90.91%
jan 1, 2015
6.25 bln
+1000.0 mln
19.05%
jan 1, 2016
6.25 bln
0.0
0.0%
Ranking of countries by current statistics by years


Comments: