29
/
en
AIzaSyAYiBZKx7MnpbEhh9jyipgxe19OcubqV5w
April 1, 2024
193505
Mauritania
MRT
true
2
1
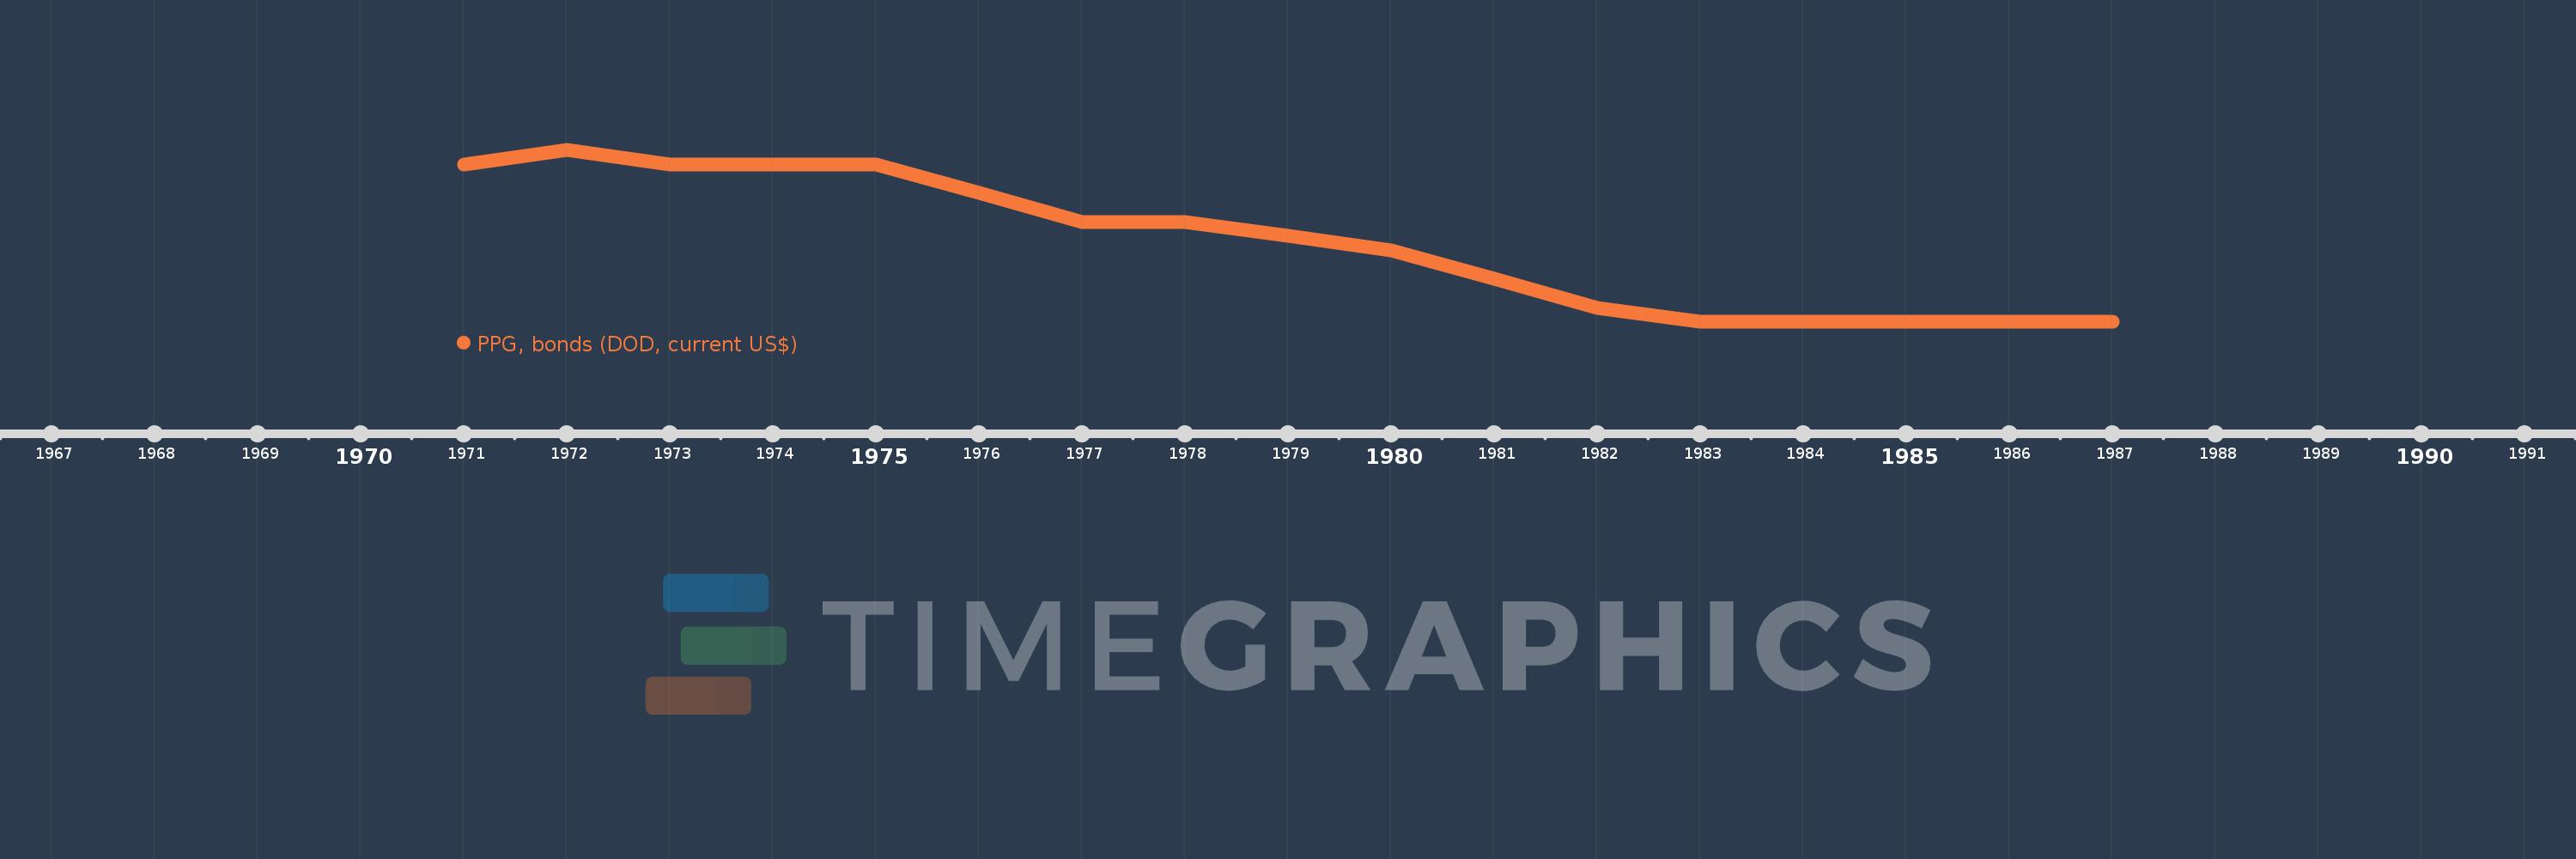
PPG, bonds (DOD, current US$)
1987,1986,1985,1984,1983,1982,1981,1980,1979,1978,1977,1976,1975,1974,1973,1972,1971
This statistics in other country:
Timeline:
This timeline shows a graph from 1971 to 1987 of Mauritania. No data until 1970. Number of actual observations by date: 17.
Source name:
World Development Indicators
Source organization:
World Bank, International Debt Statistics.
Categories, topics:
External Debt
Last updated:
apr 23, 2017
Indicators value changes by year
At the date of observation
Value
Absolute change
Change from previous value
jan 1, 1971
11.0K
+11.0K
0.0%
jan 1, 1972
12.0K
+1000.0
9.09%
jan 1, 1973
11.0K
-1000.0
-8.33%
jan 1, 1974
11.0K
0.0
0.0%
jan 1, 1975
11.0K
0.0
0.0%
jan 1, 1976
9.0K
-2.0K
-18.18%
jan 1, 1977
7.0K
-2.0K
-22.22%
jan 1, 1979
6.0K
-1000.0
-14.29%
jan 1, 1980
5.0K
-1000.0
-16.67%
jan 1, 1981
3.0K
-2.0K
-40.0%
jan 1, 1982
1000.0
-2.0K
-66.67%
jan 1, 1983
0.0
-1000.0
-100.0%
Ranking of countries by current statistics by years


Comments: