29
/
en
AIzaSyAYiBZKx7MnpbEhh9jyipgxe19OcubqV5w
April 1, 2024
210909
Nicaragua
NIC
true
2
1
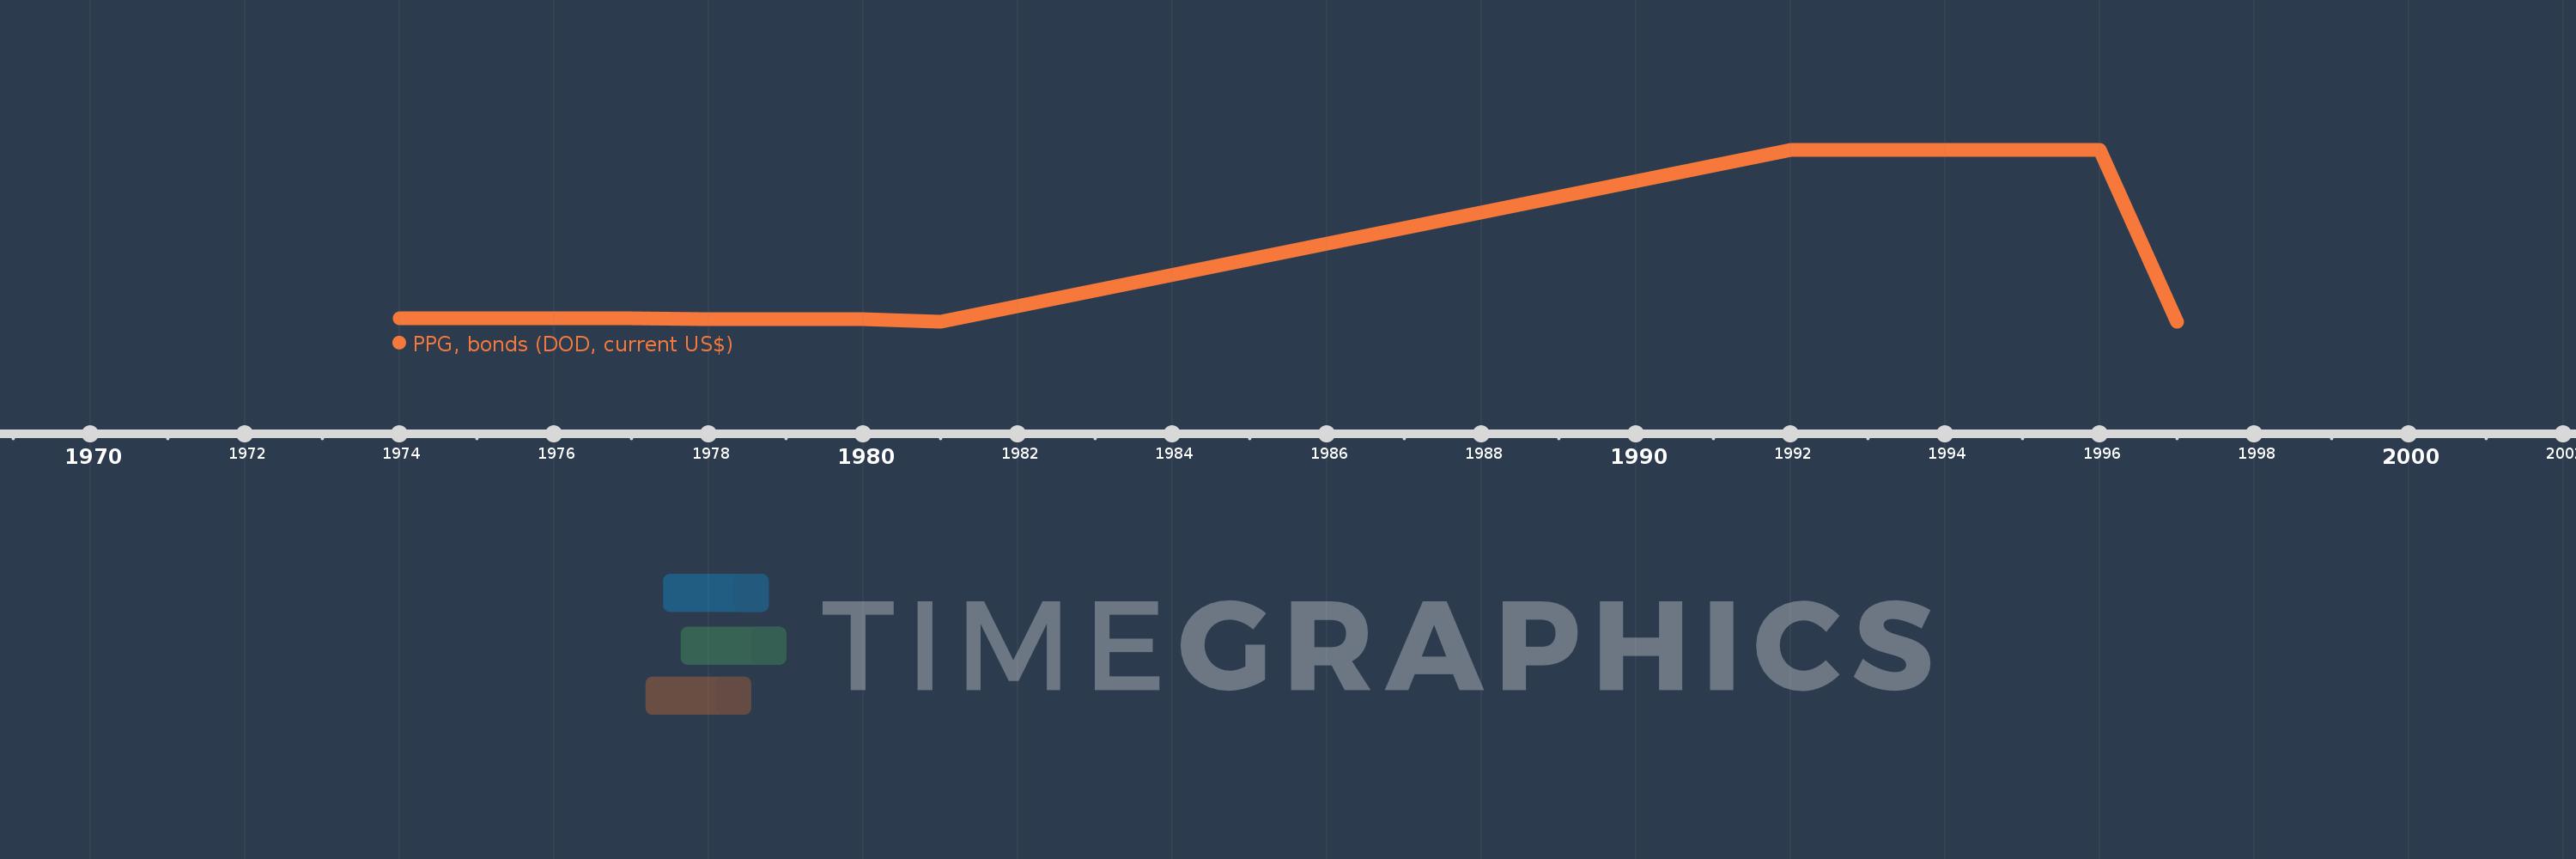
PPG, bonds (DOD, current US$)
1997,1996,1995,1994,1993,1992,1981,1980,1979,1978,1977,1976,1975,1974
This statistics in other country:
Timeline:
This timeline shows a graph from 1974 to 1997 of Nicaragua. No data until 1973. Number of actual observations by date: 14.
Source name:
World Development Indicators
Source organization:
World Bank, International Debt Statistics.
Categories, topics:
External Debt
Last updated:
apr 23, 2017
Indicators value changes by year
Maximum:
524.0 mln
jan 1, 1992
At the date of observation
Value
Absolute change
Change from previous value
jan 1, 1974
10.0 mln
+10.0 mln
0.0%
jan 1, 1975
10.0 mln
0.0
0.0%
jan 1, 1976
10.0 mln
0.0
0.0%
jan 1, 1977
10.0 mln
0.0
0.0%
jan 1, 1978
9.15 mln
-850.0K
-8.5%
jan 1, 1979
8.3 mln
-850.0K
-9.29%
jan 1, 1980
8.3 mln
0.0
0.0%
jan 1, 1981
0.0
-8.3 mln
-100.0%
jan 1, 1992
524.0 mln
+524.0 mln
%
jan 1, 1993
524.0 mln
0.0
0.0%
jan 1, 1994
524.0 mln
0.0
0.0%
jan 1, 1995
524.0 mln
0.0
0.0%
jan 1, 1996
524.0 mln
0.0
0.0%
jan 1, 1997
0.0
-524.0 mln
-100.0%
Ranking of countries by current statistics by years


Comments: