29
/
en
AIzaSyAYiBZKx7MnpbEhh9jyipgxe19OcubqV5w
April 1, 2024
216977
Pakistan
PAK
true
2
1
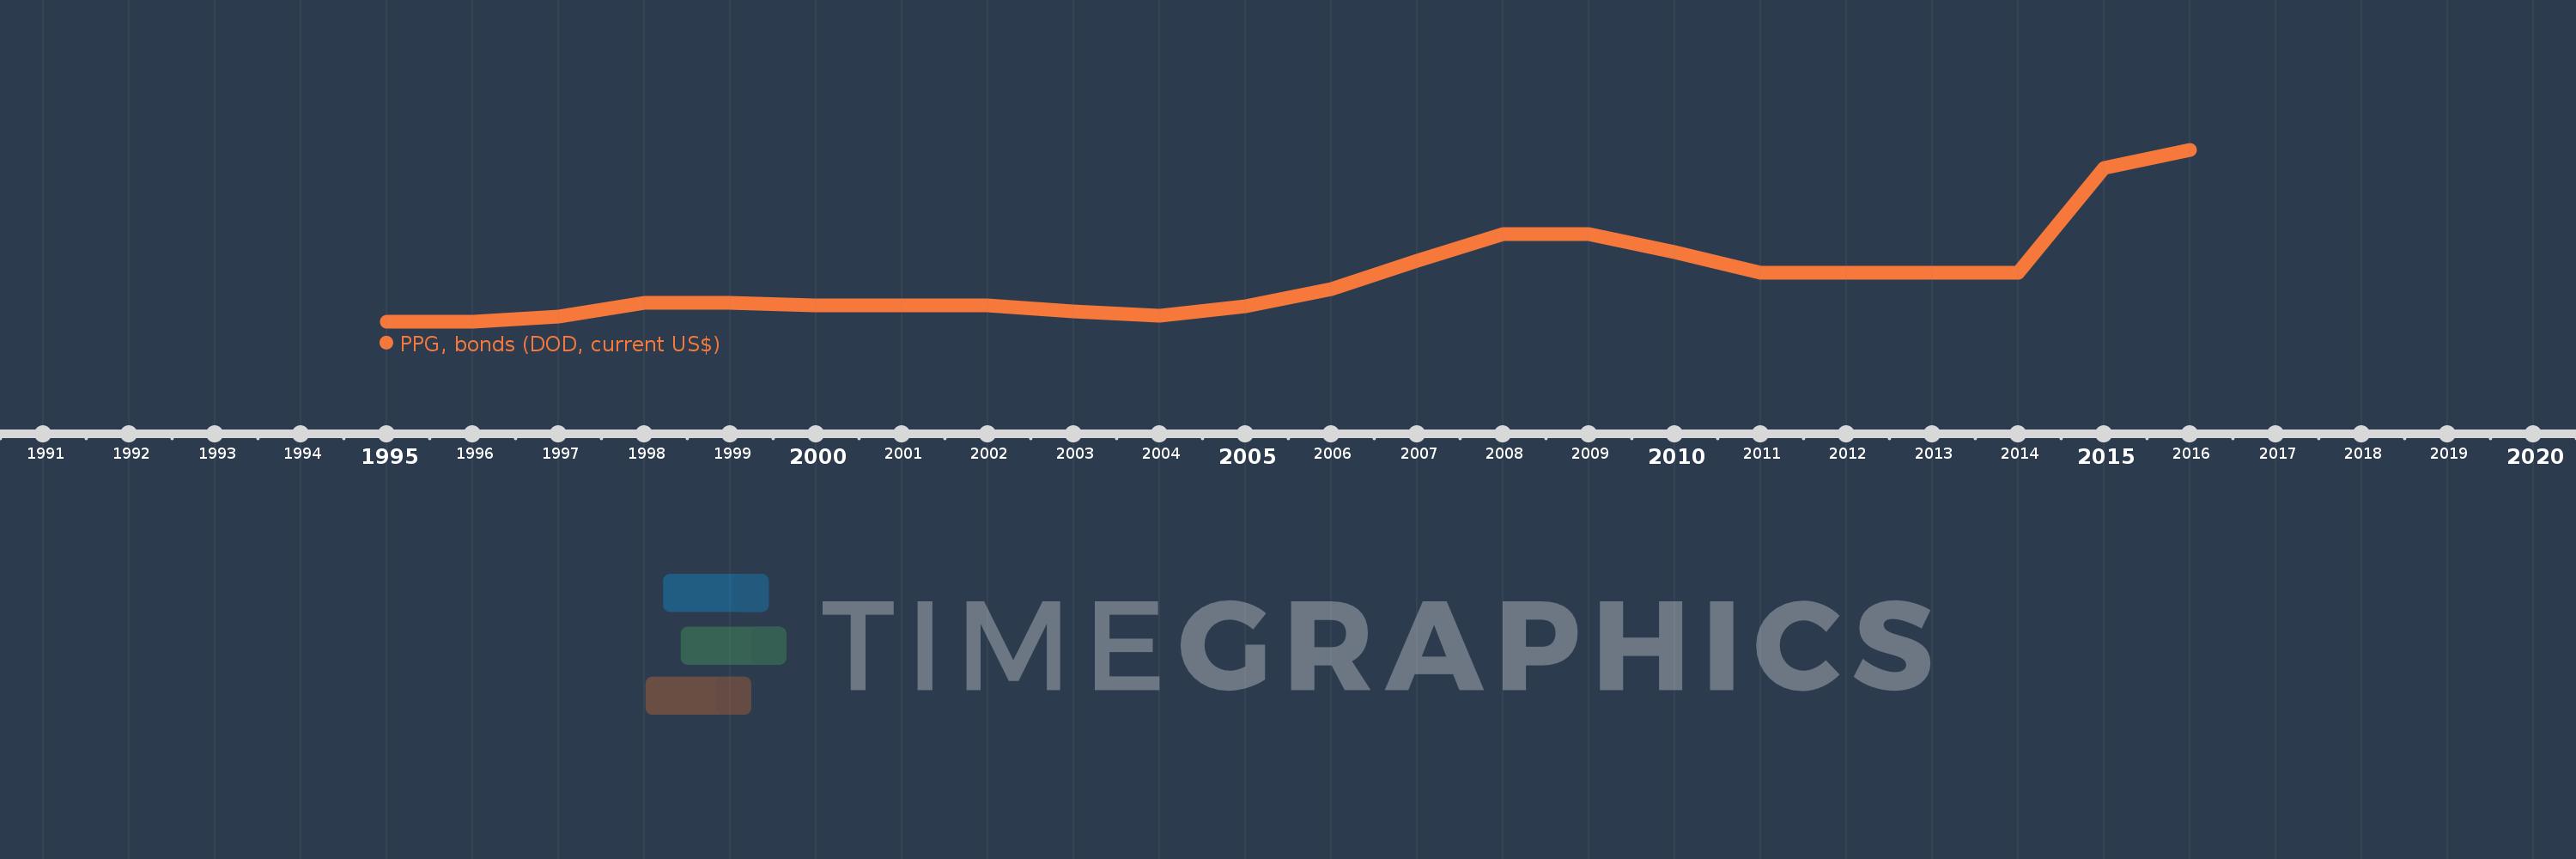
PPG, bonds (DOD, current US$)
2016,2015,2014,2013,2012,2011,2010,2009,2008,2007,2006,2005,2004,2003,2002,2001,2000,1999,1998,1997,1996,1995
This statistics in other country:
Timeline:
This timeline shows a graph from 1995 to 2016 of Pakistan. No data until 1994. Number of actual observations by date: 22.
Source name:
World Development Indicators
Source organization:
World Bank, International Debt Statistics.
Categories, topics:
External Debt
Last updated:
apr 23, 2017
Indicators value changes by year
Minimum:
150.0 mln
jan 1, 1995
Maximum:
5.05 bln
jan 1, 2016
At the date of observation
Value
Absolute change
Change from previous value
jan 1, 1995
150.0 mln
+150.0 mln
0.0%
jan 1, 1996
150.0 mln
0.0
0.0%
jan 1, 1997
310.0 mln
+160.0 mln
106.67%
jan 1, 1998
685.0 mln
+375.0 mln
120.97%
jan 1, 1999
685.0 mln
0.0
0.0%
jan 1, 2000
623.0 mln
-62.0 mln
-9.05%
jan 1, 2001
623.0 mln
0.0
0.0%
jan 1, 2002
623.0 mln
0.0
0.0%
jan 1, 2003
445.0 mln
-178.0 mln
-28.57%
jan 1, 2004
325.0 mln
-120.0 mln
-26.97%
jan 1, 2005
608.334 mln
+283.334 mln
87.18%
jan 1, 2006
1.1 bln
+491.666 mln
80.82%
jan 1, 2007
1.9 bln
+800.0 mln
72.73%
jan 1, 2008
2.65 bln
+750.0 mln
39.47%
jan 1, 2009
2.65 bln
0.0
0.0%
jan 1, 2010
2.15 bln
-500.0 mln
-18.87%
jan 1, 2011
1.55 bln
-600.0 mln
-27.91%
jan 1, 2012
1.55 bln
0.0
0.0%
jan 1, 2013
1.55 bln
0.0
0.0%
jan 1, 2014
1.55 bln
0.0
0.0%
jan 1, 2015
4.55 bln
+3.0 bln
193.55%
jan 1, 2016
5.05 bln
+500.0 mln
10.99%
Ranking of countries by current statistics by years


Comments: