30
/
AIzaSyAYiBZKx7MnpbEhh9jyipgxe19OcubqV5w
April 1, 2024
220061
Papua New Guinea
PNG
true
2
1
PPG, bonds (DOD, current US$)
1996,1995,1994,1993,1992,1991,1990,1989,1988,1987,1986,1985,1984,1983,1982,1981,1980,1979,1978,1977,1976,1975,1974
Public Timelines
FAQ
Menu
Public Timelines
FAQ
For education
For educational institutions
For teachers
For students
Open cabinet
Create
Close
Create a timeline
Public timelines
Library
FAQ
Download
Global statistics library
→
Papua New Guinea
→
PPG, bonds (DOD, current US$)
This statistics in other country:
Albania
Algeria
Angola
Argentina
Armenia
Azerbaijan
Belarus
Belize
Benin
Bolivia
Bosnia and Herzegovina
Botswana
Brazil
Bulgaria
Burkina Faso
Cameroon
China
Colombia
Congo, Dem. Rep.
Congo, Rep.
Costa Rica
Cote d'Ivoire
Dominica
Dominican Republic
East Asia & Pacific (excluding high income)
Ecuador
Egypt, Arab Rep.
El Salvador
Ethiopia
Europe & Central Asia (excluding high income)
Fiji
Gabon
Georgia
Ghana
Grenada
Guatemala
Guinea
Guyana
Haiti
Honduras
IDA only
India
Indonesia
Jamaica
Jordan
Kazakhstan
Kenya
Lao PDR
Latin America & Caribbean (excluding high income)
Lebanon
Low & middle income
Low income
Lower middle income
Macedonia, FYR
Malawi
Malaysia
Mauritania
Mauritius
Mexico
Middle East & North Africa (excluding high income)
Middle income
Moldova
Mongolia
Montenegro
Morocco
Mozambique
Nicaragua
Niger
Nigeria
Pakistan
Panama
Papua New Guinea
Paraguay
Peru
Philippines
Romania
Russian Federation
Rwanda
Samoa
Senegal
Serbia
Sierra Leone
South Africa
South Asia
Sri Lanka
St. Lucia
St. Vincent and the Grenadines
Sub-Saharan Africa (excluding high income)
Sudan
Thailand
Togo
Tunisia
Turkey
Uganda
Ukraine
Upper middle income
Venezuela, RB
Vietnam
Zambia
Zimbabwe
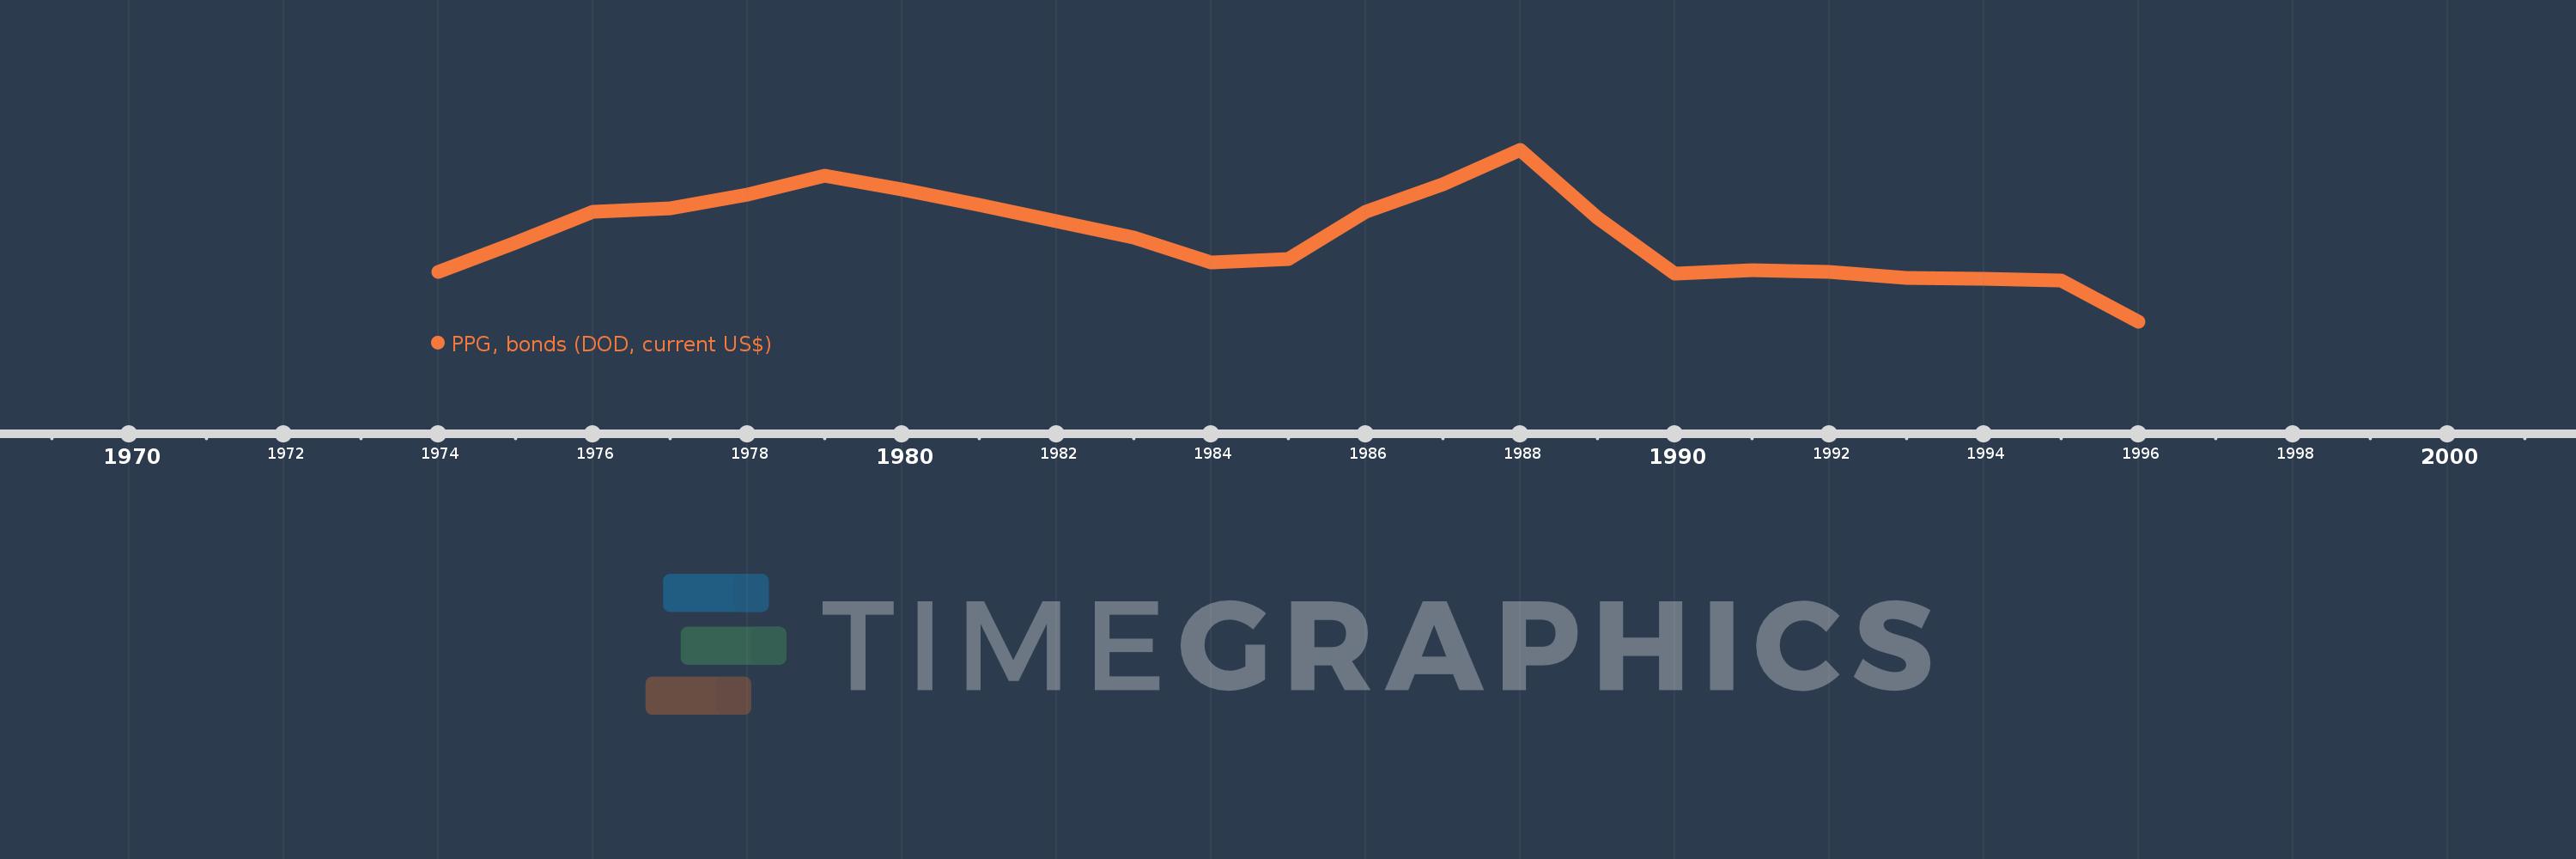
Timeline:
This timeline shows a graph from
1974
to
1996
of Papua New Guinea. No data until
1973
. Number of actual observations by date:
23
.
Source name:
World Development Indicators
Source organization:
World Bank, International Debt Statistics.
Categories, topics:
External Debt
Last updated:
apr 23, 2017
Indicators value changes by year
Meaning:
62.444 mln
Minimum:
0.0
jan 1, 1996
Maximum:
124.164 mln
jan 1, 1988
At the date of observation
Value
Absolute change
Change from the previous value
jan 1, 1974
36.353 mln
+36.353 mln
0.0%
jan 1, 1975
57.051 mln
+20.698 mln
56.94%
jan 1, 1976
79.345 mln
+22.294 mln
39.08%
jan 1, 1977
82.439 mln
+3.094 mln
3.9%
jan 1, 1978
92.215 mln
+9.776 mln
11.86%
jan 1, 1979
105.603 mln
+13.388 mln
14.52%
jan 1, 1980
95.592 mln
-10.011 mln
-9.48%
jan 1, 1981
84.611 mln
-10.981 mln
-11.49%
jan 1, 1982
73.124 mln
-11.487 mln
-13.58%
jan 1, 1983
61.259 mln
-11.865 mln
-16.23%
jan 1, 1984
43.16 mln
-18.099 mln
-29.55%
jan 1, 1985
45.419 mln
+2.259 mln
5.23%
jan 1, 1986
79.579 mln
+34.16 mln
75.21%
jan 1, 1987
99.725 mln
+20.146 mln
25.32%
jan 1, 1988
124.164 mln
+24.439 mln
24.51%
jan 1, 1989
75.144 mln
-49.02 mln
-39.48%
jan 1, 1990
34.855 mln
-40.289 mln
-53.62%
jan 1, 1991
37.202 mln
+2.347 mln
6.73%
jan 1, 1992
35.942 mln
-1.26 mln
-3.39%
jan 1, 1993
32.064 mln
-3.878 mln
-10.79%
jan 1, 1994
31.292 mln
-772.0K
-2.41%
jan 1, 1995
30.078 mln
-1.214 mln
-3.88%
jan 1, 1996
0.0
-30.078 mln
-100.0%
Ranking of countries by current statistics by years
About & Feedback
Terms
Privacy
Library
2024
©
Time.Graphics
Support 24/7
Cabinet
Get premium
Donate
The service accepts bank transfer (ACH, Wire) or cards (Visa, MasterCard, etc). Processed by Stripe.
Secured with SSL
Excellent (Trustpilot Reviews)
Based on 115+ reviews
Write your own review on
Trustpilot.com
