29
/
en
AIzaSyAYiBZKx7MnpbEhh9jyipgxe19OcubqV5w
April 1, 2024
194764
Mauritius
MUS
true
2
1
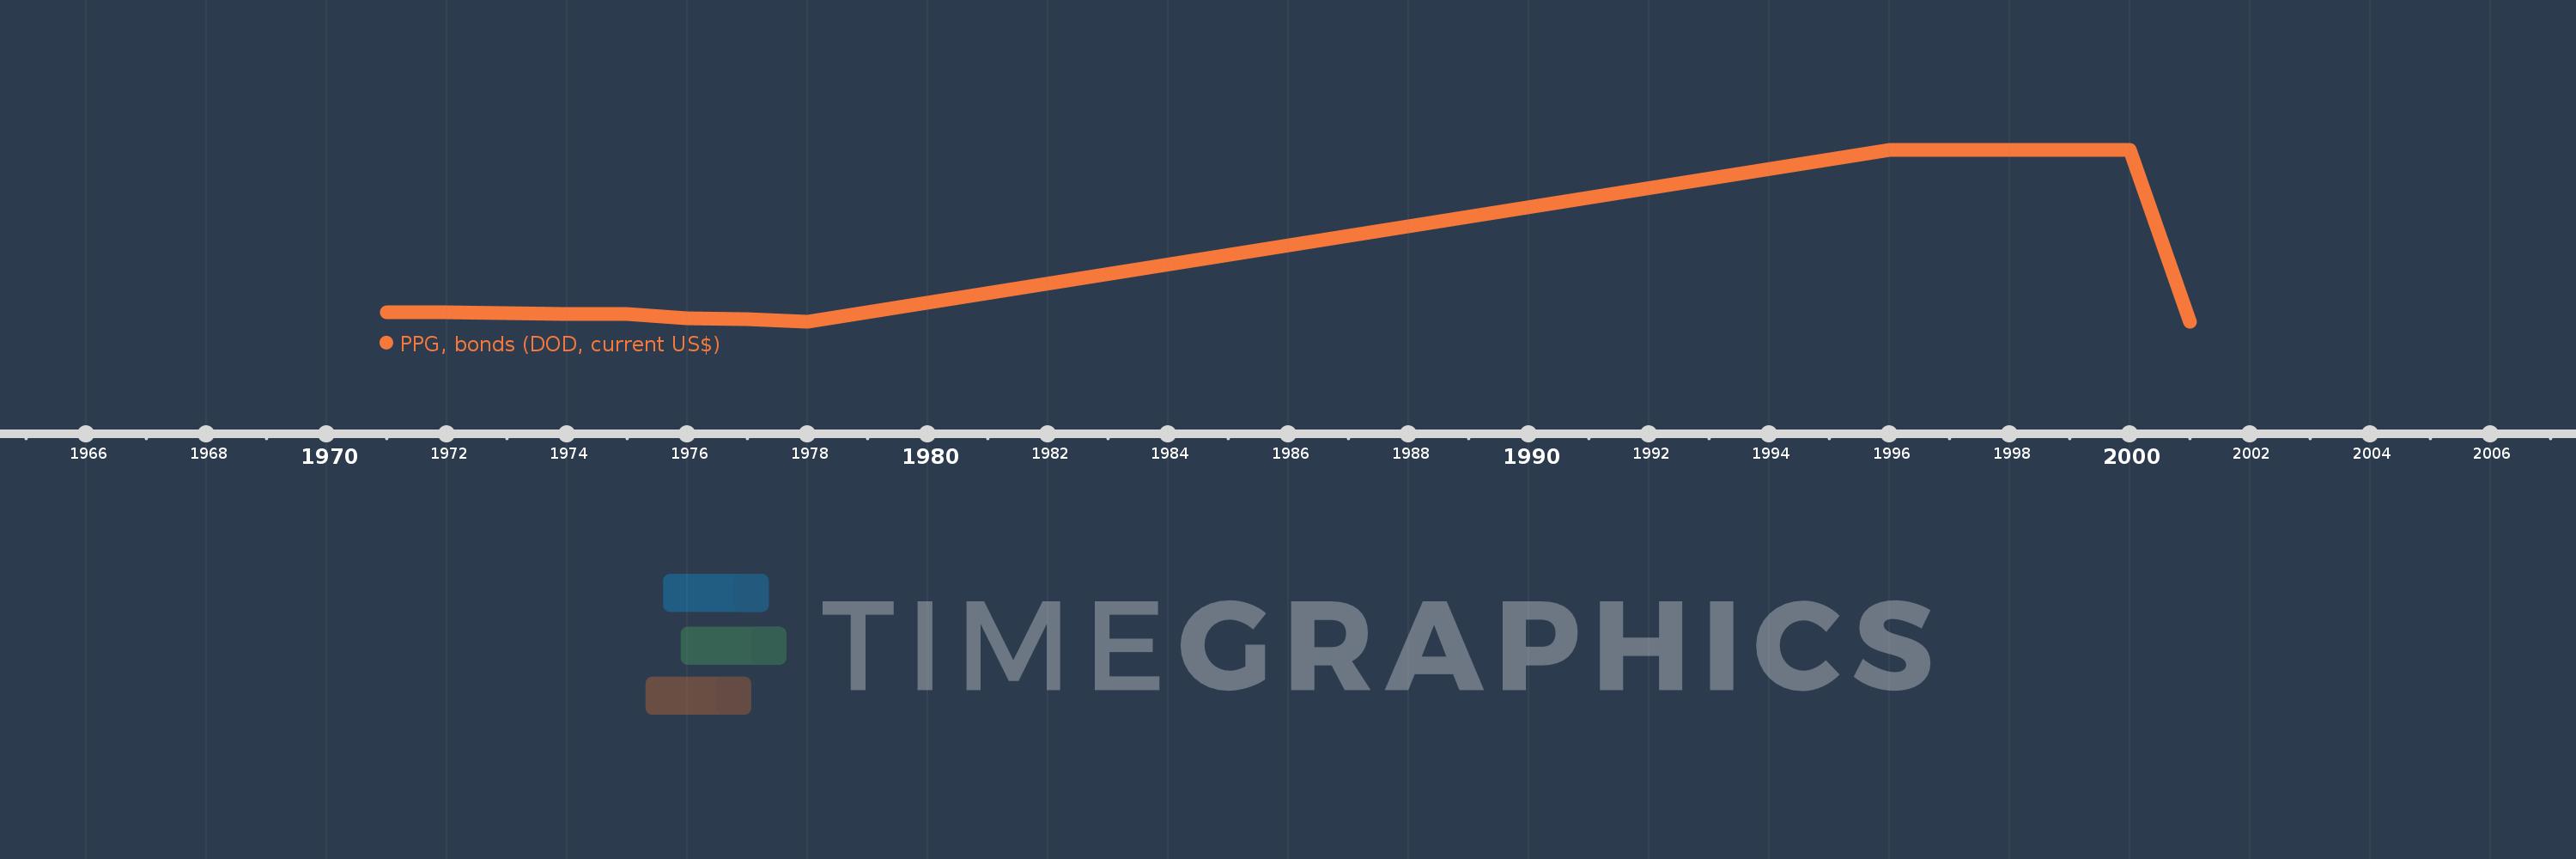
PPG, bonds (DOD, current US$)
2001,2000,1999,1998,1997,1996,1978,1977,1976,1975,1974,1973,1972,1971
This statistics in other country:
Timeline:
This timeline shows a graph from 1971 to 2001 of Mauritius. No data until 1970. Number of actual observations by date: 14.
Source name:
World Development Indicators
Source organization:
World Bank, International Debt Statistics.
Categories, topics:
External Debt
Last updated:
apr 23, 2017
Indicators value changes by year
Maximum:
150.0 mln
jan 1, 1996
At the date of observation
Value
Absolute change
Change from previous value
jan 1, 1971
8.455 mln
+8.455 mln
0.0%
jan 1, 1972
8.782 mln
+327.0K
3.87%
jan 1, 1973
7.871 mln
-911.0K
-10.37%
jan 1, 1974
7.202 mln
-669.0K
-8.5%
jan 1, 1975
7.111 mln
-91.0K
-1.26%
jan 1, 1976
3.173 mln
-3.938 mln
-55.38%
jan 1, 1977
2.581 mln
-592.0K
-18.66%
jan 1, 1978
0.0
-2.581 mln
-100.0%
jan 1, 1996
150.0 mln
+150.0 mln
%
jan 1, 1997
150.0 mln
0.0
0.0%
jan 1, 1998
150.0 mln
0.0
0.0%
jan 1, 1999
150.0 mln
0.0
0.0%
jan 1, 2000
150.0 mln
0.0
0.0%
jan 1, 2001
0.0
-150.0 mln
-100.0%
Ranking of countries by current statistics by years


Comments: