29
/
en
AIzaSyAYiBZKx7MnpbEhh9jyipgxe19OcubqV5w
April 1, 2024
230429
Russian Federation
RUS
true
2
1
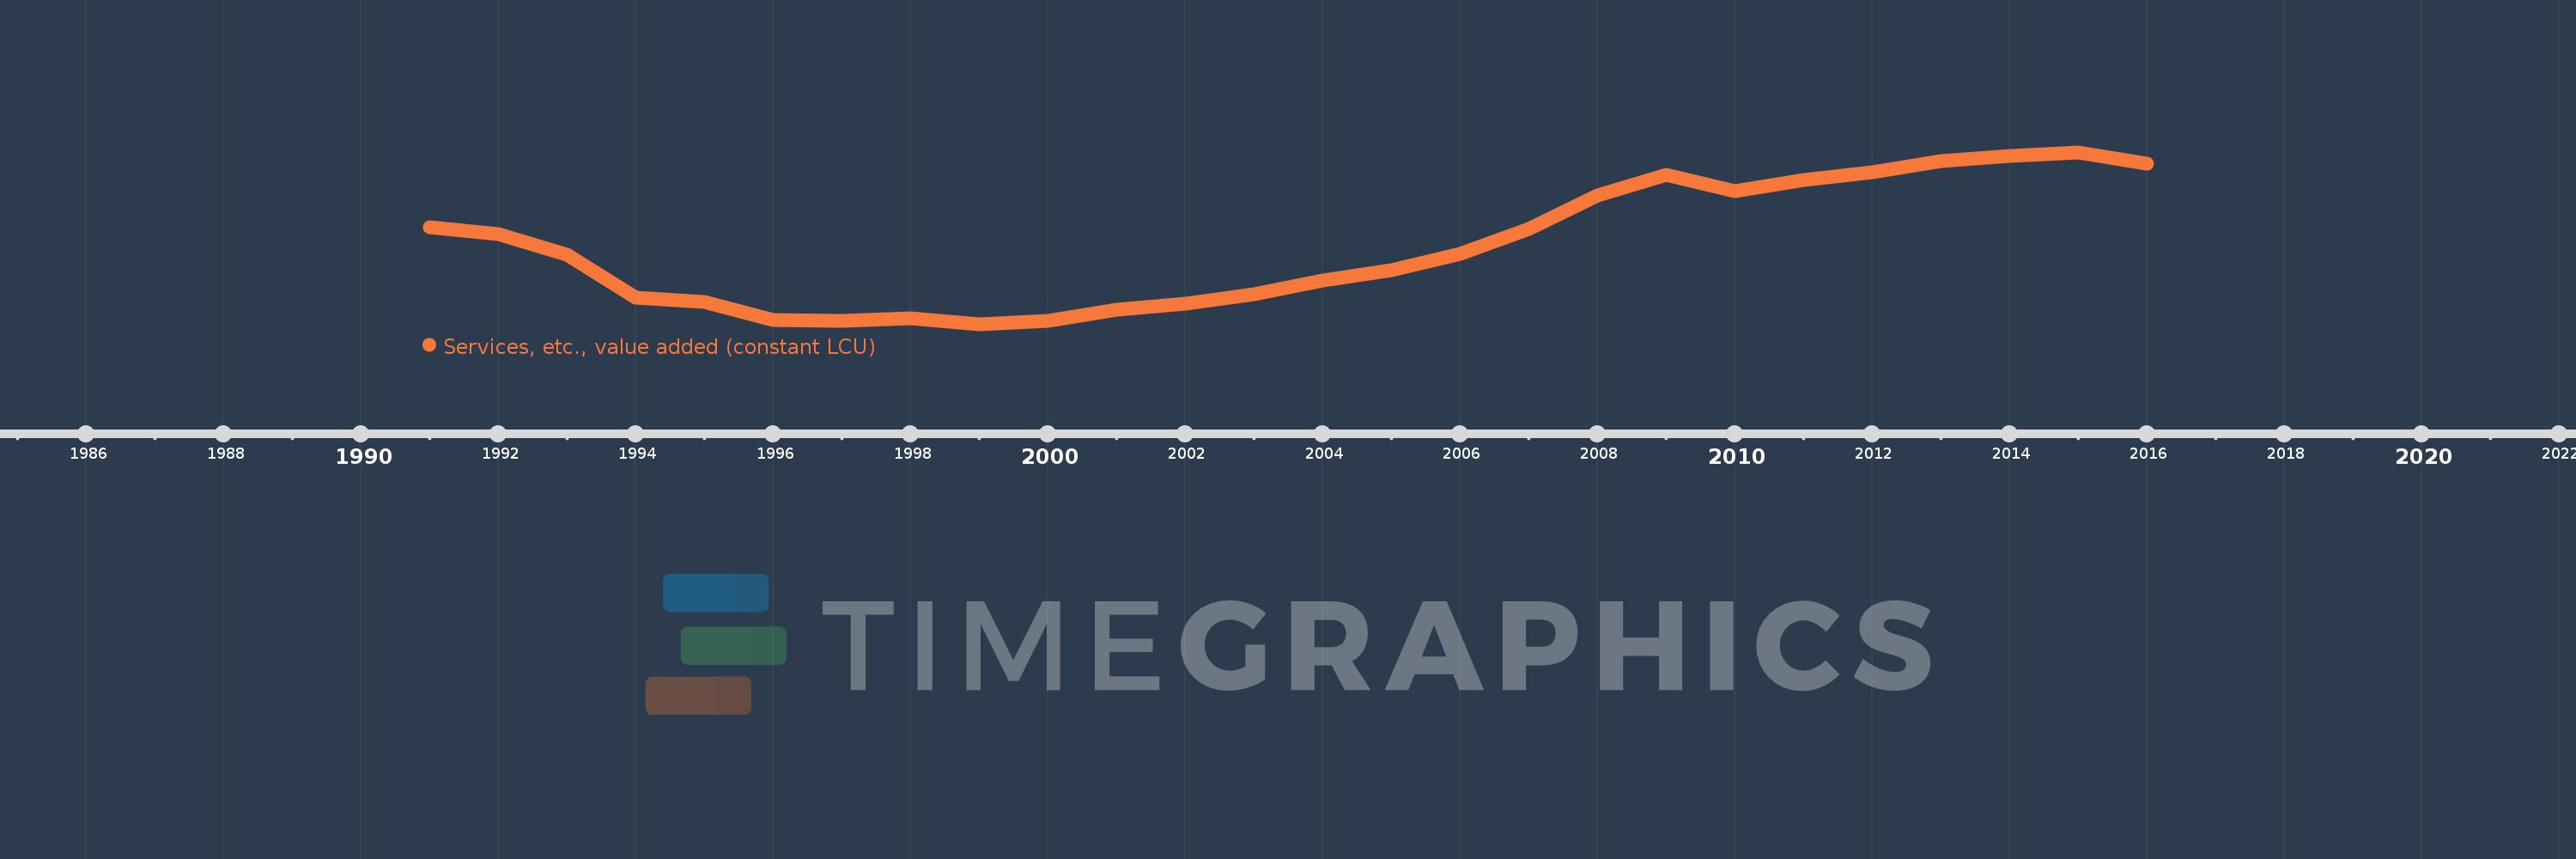
Services, etc., value added (constant LCU)
2016,2015,2014,2013,2012,2011,2010,2009,2008,2007,2006,2005,2004,2003,2002,2001,2000,1999,1998,1997,1996,1995,1994,1993,1992,1991
This statistics in other country:
AfghanistanAlbaniaAlgeriaAntigua and BarbudaArgentinaArmeniaAustraliaAustriaAzerbaijanBahamas, TheBahrainBangladeshBelarusBelgiumBelizeBeninBermudaBhutanBoliviaBosnia and HerzegovinaBotswanaBrazilBrunei DarussalamBulgariaBurkina FasoBurundiCabo VerdeCambodiaCameroonCanadaCentral African RepublicChadChileChinaColombiaComorosCongo, Dem. Rep.Congo, Rep.Costa RicaCote d'IvoireCroatiaCubaCyprusCzech RepublicDenmarkDjiboutiDominicaDominican RepublicEcuadorEgypt, Arab Rep.El SalvadorEquatorial GuineaEritreaEstoniaEthiopiaFijiFinlandFranceGabonGambia, TheGeorgiaGermanyGhanaGreeceGrenadaGuatemalaGuineaGuinea-BissauGuyanaHaitiHondurasHong Kong SAR, ChinaHungaryIcelandIndiaIndonesiaIran, Islamic Rep.IraqIrelandItalyJamaicaJapanJordanKazakhstanKenyaKiribatiKorea, Rep.KosovoKuwaitKyrgyz RepublicLao PDRLatviaLebanonLesothoLiberiaLithuaniaLuxembourgMacedonia, FYRMadagascarMalawiMalaysiaMaldivesMaliMarshall IslandsMauritaniaMauritiusMexicoMicronesia, Fed. Sts.MoldovaMongoliaMontenegroMoroccoMozambiqueMyanmarNamibiaNepalNetherlandsNew ZealandNicaraguaNigerNigeriaNorwayOmanPakistanPalauPanamaPapua New GuineaParaguayPeruPhilippinesPolandPortugalPuerto RicoQatarRomaniaRussian FederationRwandaSamoaSao Tome and PrincipeSaudi ArabiaSenegalSerbiaSeychellesSierra LeoneSingaporeSlovak RepublicSloveniaSolomon IslandsSomaliaSouth AfricaSpainSri LankaSt. Kitts and NevisSt. LuciaSt. Vincent and the GrenadinesSudanSurinameSwazilandSwedenSwitzerlandSyrian Arab RepublicTajikistanTanzaniaThailandTimor-LesteTogoTongaTrinidad and TobagoTunisiaTurkeyTurkmenistanTuvaluUgandaUkraineUnited Arab EmiratesUnited KingdomUnited StatesUruguayUzbekistanVanuatuVenezuela, RBVietnamWest Bank and GazaZambiaZimbabwe Timeline:
This timeline shows a graph from 1991 to 2016 of Russian Federation. No data until 1990. Number of actual observations by date: 26.
Source name:
World Development Indicators
Source organization:
World Bank national accounts data, and OECD National Accounts data files.
Categories, topics:
Economy & Growth
Last updated:
apr 23, 2017
Indicators value changes by year
Minimum:
16.099 trl
jan 1, 1999
Maximum:
34.126 trl
jan 1, 2015
At the date of observation
Value
Absolute change
Change from previous value
jan 1, 1991
26.264 trl
+26.264 trl
0.0%
jan 1, 1992
25.589 trl
-675.605 bln
-2.57%
jan 1, 1993
23.431 trl
-2.157 trl
-8.43%
jan 1, 1994
18.867 trl
-4.564 trl
-19.48%
jan 1, 1995
18.398 trl
-468.824 bln
-2.48%
jan 1, 1996
16.535 trl
-1.863 trl
-10.13%
jan 1, 1997
16.43 trl
-105.211 bln
-0.64%
jan 1, 1998
16.696 trl
+265.604 bln
1.62%
jan 1, 1999
16.099 trl
-596.324 bln
-3.57%
jan 1, 2000
16.461 trl
+362.028 bln
2.25%
jan 1, 2001
17.629 trl
+1.168 trl
7.09%
jan 1, 2002
18.258 trl
+629.023 bln
3.57%
jan 1, 2003
19.27 trl
+1.011 trl
5.54%
jan 1, 2004
20.724 trl
+1.454 trl
7.55%
jan 1, 2005
21.773 trl
+1.049 trl
5.06%
jan 1, 2006
23.521 trl
+1.748 trl
8.03%
jan 1, 2007
26.082 trl
+2.56 trl
10.88%
jan 1, 2008
29.634 trl
+3.553 trl
13.62%
jan 1, 2009
31.744 trl
+2.11 trl
7.12%
jan 1, 2010
30.071 trl
-1.673 trl
-5.27%
jan 1, 2011
31.233 trl
+1.162 trl
3.86%
jan 1, 2012
32.036 trl
+802.424 bln
2.57%
jan 1, 2013
33.219 trl
+1.183 trl
3.69%
jan 1, 2014
33.718 trl
+498.987 bln
1.5%
jan 1, 2015
34.126 trl
+408.032 bln
1.21%
jan 1, 2016
32.936 trl
-1.19 trl
-3.49%
Ranking of countries by current statistics by years


Comments: