29
/
en
AIzaSyAYiBZKx7MnpbEhh9jyipgxe19OcubqV5w
April 1, 2024
181624
Lithuania
LTU
true
2
1
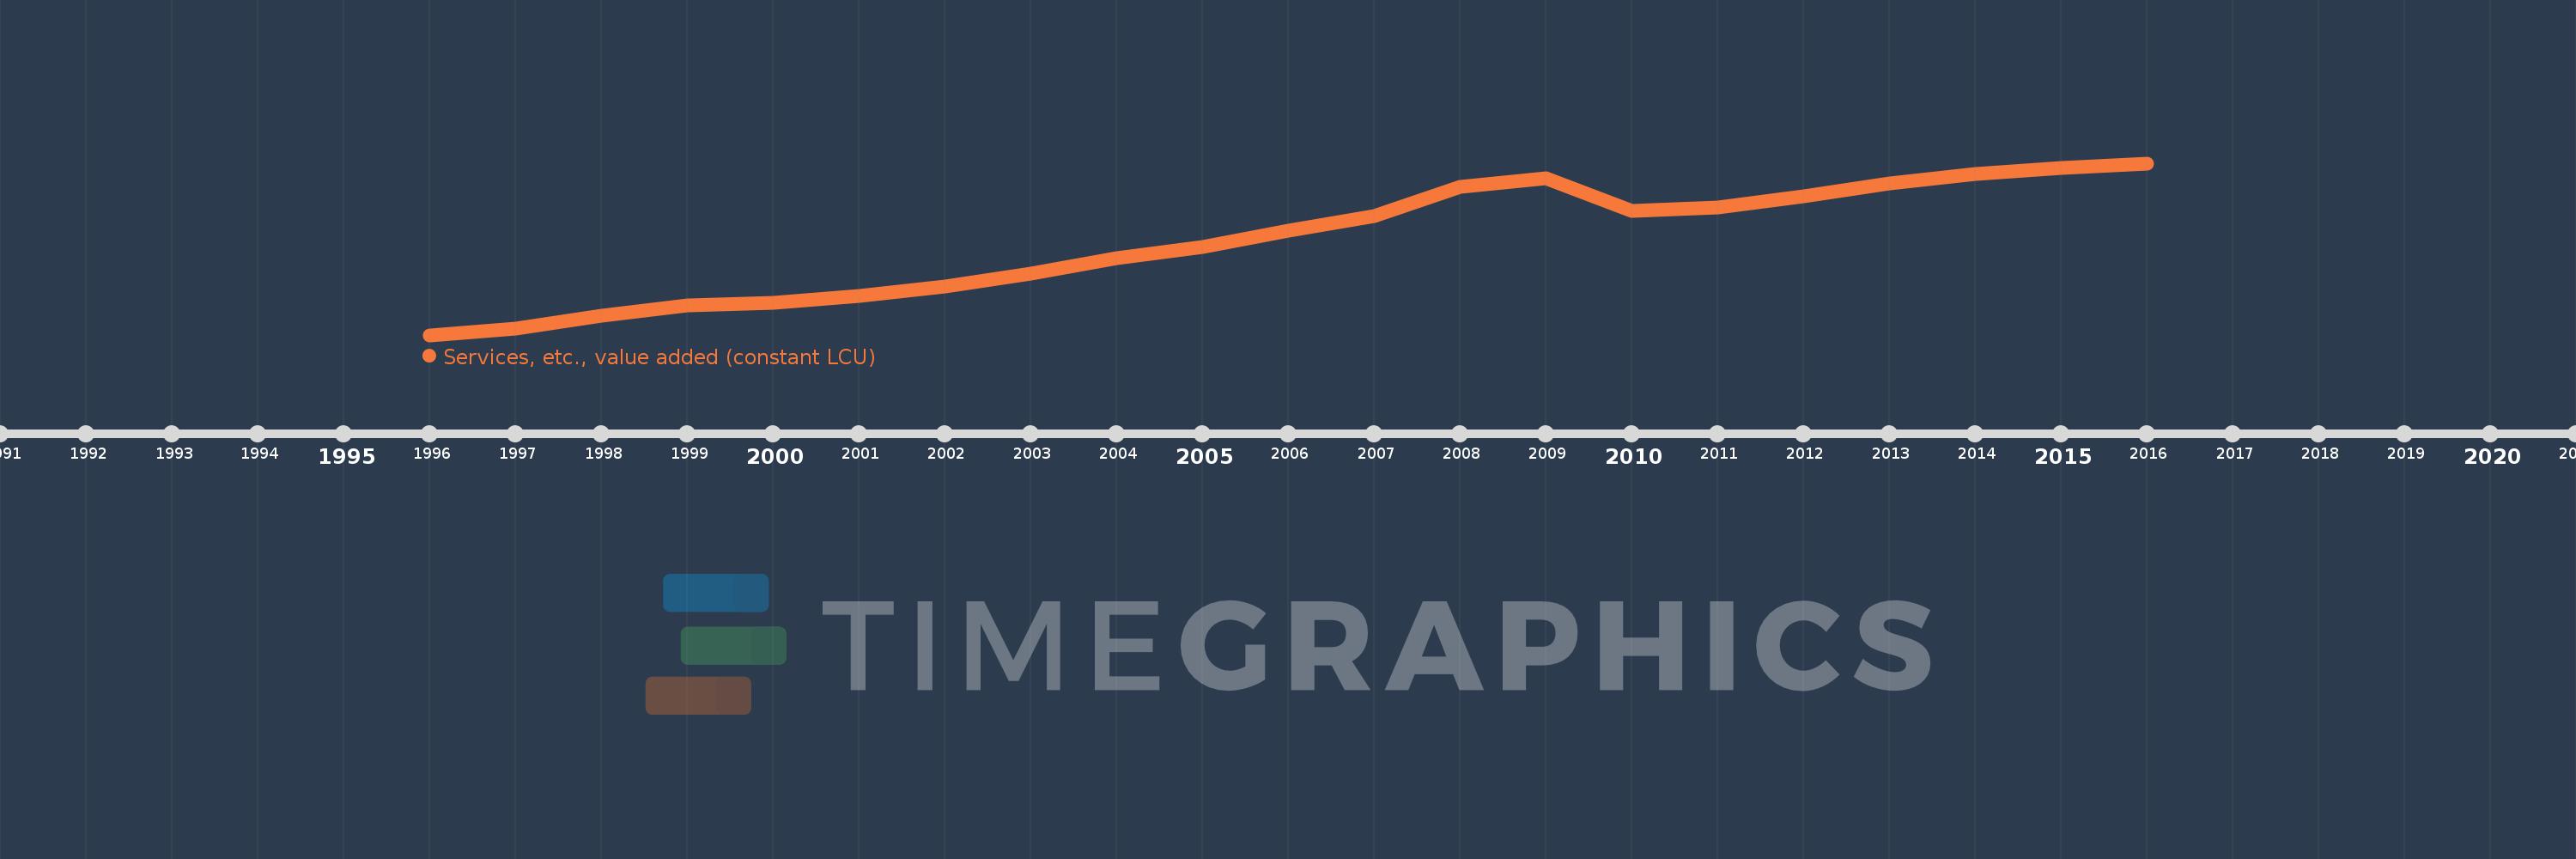
Services, etc., value added (constant LCU)
2016,2015,2014,2013,2012,2011,2010,2009,2008,2007,2006,2005,2004,2003,2002,2001,2000,1999,1998,1997,1996
This statistics in other country:
AfghanistanAlbaniaAlgeriaAntigua and BarbudaArgentinaArmeniaAustraliaAustriaAzerbaijanBahamas, TheBahrainBangladeshBelarusBelgiumBelizeBeninBermudaBhutanBoliviaBosnia and HerzegovinaBotswanaBrazilBrunei DarussalamBulgariaBurkina FasoBurundiCabo VerdeCambodiaCameroonCanadaCentral African RepublicChadChileChinaColombiaComorosCongo, Dem. Rep.Congo, Rep.Costa RicaCote d'IvoireCroatiaCubaCyprusCzech RepublicDenmarkDjiboutiDominicaDominican RepublicEcuadorEgypt, Arab Rep.El SalvadorEquatorial GuineaEritreaEstoniaEthiopiaFijiFinlandFranceGabonGambia, TheGeorgiaGermanyGhanaGreeceGrenadaGuatemalaGuineaGuinea-BissauGuyanaHaitiHondurasHong Kong SAR, ChinaHungaryIcelandIndiaIndonesiaIran, Islamic Rep.IraqIrelandItalyJamaicaJapanJordanKazakhstanKenyaKiribatiKorea, Rep.KosovoKuwaitKyrgyz RepublicLao PDRLatviaLebanonLesothoLiberiaLithuaniaLuxembourgMacedonia, FYRMadagascarMalawiMalaysiaMaldivesMaliMarshall IslandsMauritaniaMauritiusMexicoMicronesia, Fed. Sts.MoldovaMongoliaMontenegroMoroccoMozambiqueMyanmarNamibiaNepalNetherlandsNew ZealandNicaraguaNigerNigeriaNorwayOmanPakistanPalauPanamaPapua New GuineaParaguayPeruPhilippinesPolandPortugalPuerto RicoQatarRomaniaRussian FederationRwandaSamoaSao Tome and PrincipeSaudi ArabiaSenegalSerbiaSeychellesSierra LeoneSingaporeSlovak RepublicSloveniaSolomon IslandsSomaliaSouth AfricaSpainSri LankaSt. Kitts and NevisSt. LuciaSt. Vincent and the GrenadinesSudanSurinameSwazilandSwedenSwitzerlandSyrian Arab RepublicTajikistanTanzaniaThailandTimor-LesteTogoTongaTrinidad and TobagoTunisiaTurkeyTurkmenistanTuvaluUgandaUkraineUnited Arab EmiratesUnited KingdomUnited StatesUruguayUzbekistanVanuatuVenezuela, RBVietnamWest Bank and GazaZambiaZimbabwe Timeline:
This timeline shows a graph from 1996 to 2016 of Lithuania. No data until 1995. Number of actual observations by date: 21.
Source name:
World Development Indicators
Source organization:
World Bank national accounts data, and OECD National Accounts data files.
Categories, topics:
Economy & Growth
Last updated:
apr 23, 2017
Indicators value changes by year
Minimum:
8.817 bln
jan 1, 1996
Maximum:
19.913 bln
jan 1, 2016
At the date of observation
Value
Absolute change
Change from previous value
jan 1, 1996
8.817 bln
+8.817 bln
0.0%
jan 1, 1997
9.216 bln
+398.988 mln
4.53%
jan 1, 1998
10.052 bln
+835.418 mln
9.06%
jan 1, 1999
10.715 bln
+663.154 mln
6.6%
jan 1, 2000
10.878 bln
+163.75 mln
1.53%
jan 1, 2001
11.366 bln
+487.196 mln
4.48%
jan 1, 2002
11.955 bln
+589.793 mln
5.19%
jan 1, 2003
12.771 bln
+815.478 mln
6.82%
jan 1, 2004
13.805 bln
+1.034 bln
8.1%
jan 1, 2005
14.511 bln
+705.976 mln
5.11%
jan 1, 2006
15.58 bln
+1.069 bln
7.36%
jan 1, 2007
16.512 bln
+931.963 mln
5.98%
jan 1, 2008
18.369 bln
+1.857 bln
11.25%
jan 1, 2009
18.935 bln
+566.401 mln
3.08%
jan 1, 2010
16.846 bln
-2.09 bln
-11.04%
jan 1, 2011
17.044 bln
+198.163 mln
1.18%
jan 1, 2012
17.798 bln
+754.139 mln
4.42%
jan 1, 2013
18.587 bln
+788.977 mln
4.43%
jan 1, 2014
19.229 bln
+642.078 mln
3.45%
jan 1, 2015
19.585 bln
+356.197 mln
1.85%
jan 1, 2016
19.913 bln
+327.947 mln
1.67%
Ranking of countries by current statistics by years


Comments: