29
/
en
AIzaSyAYiBZKx7MnpbEhh9jyipgxe19OcubqV5w
April 1, 2024
97977
Cabo Verde
CPV
true
2
1
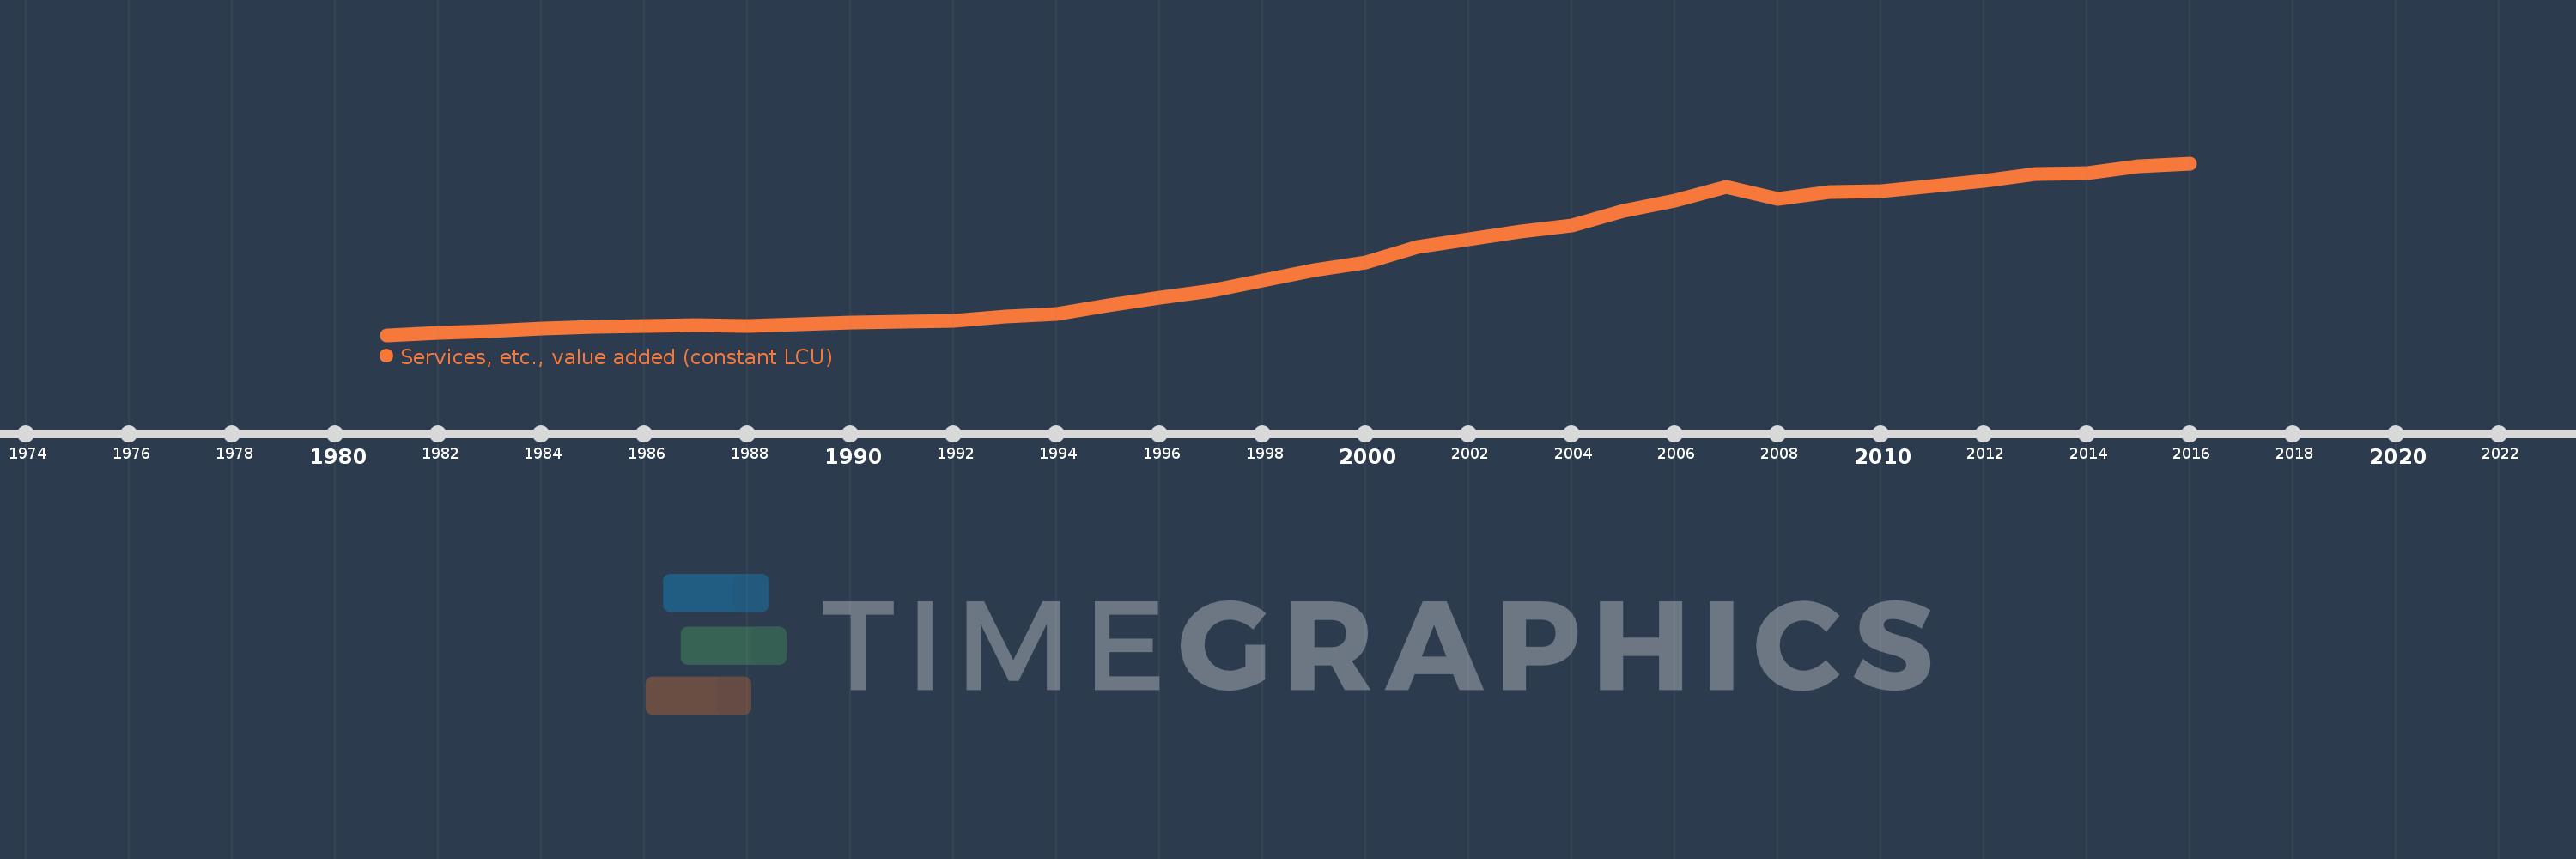
Services, etc., value added (constant LCU)
2016,2015,2014,2013,2012,2011,2010,2009,2008,2007,2006,2005,2004,2003,2002,2001,2000,1999,1998,1997,1996,1995,1994,1993,1992,1991,1990,1989,1988,1987,1986,1985,1984,1983,1982,1981
This statistics in other country:
AfghanistanAlbaniaAlgeriaAntigua and BarbudaArgentinaArmeniaAustraliaAustriaAzerbaijanBahamas, TheBahrainBangladeshBelarusBelgiumBelizeBeninBermudaBhutanBoliviaBosnia and HerzegovinaBotswanaBrazilBrunei DarussalamBulgariaBurkina FasoBurundiCabo VerdeCambodiaCameroonCanadaCentral African RepublicChadChileChinaColombiaComorosCongo, Dem. Rep.Congo, Rep.Costa RicaCote d'IvoireCroatiaCubaCyprusCzech RepublicDenmarkDjiboutiDominicaDominican RepublicEcuadorEgypt, Arab Rep.El SalvadorEquatorial GuineaEritreaEstoniaEthiopiaFijiFinlandFranceGabonGambia, TheGeorgiaGermanyGhanaGreeceGrenadaGuatemalaGuineaGuinea-BissauGuyanaHaitiHondurasHong Kong SAR, ChinaHungaryIcelandIndiaIndonesiaIran, Islamic Rep.IraqIrelandItalyJamaicaJapanJordanKazakhstanKenyaKiribatiKorea, Rep.KosovoKuwaitKyrgyz RepublicLao PDRLatviaLebanonLesothoLiberiaLithuaniaLuxembourgMacedonia, FYRMadagascarMalawiMalaysiaMaldivesMaliMarshall IslandsMauritaniaMauritiusMexicoMicronesia, Fed. Sts.MoldovaMongoliaMontenegroMoroccoMozambiqueMyanmarNamibiaNepalNetherlandsNew ZealandNicaraguaNigerNigeriaNorwayOmanPakistanPalauPanamaPapua New GuineaParaguayPeruPhilippinesPolandPortugalPuerto RicoQatarRomaniaRussian FederationRwandaSamoaSao Tome and PrincipeSaudi ArabiaSenegalSerbiaSeychellesSierra LeoneSingaporeSlovak RepublicSloveniaSolomon IslandsSomaliaSouth AfricaSpainSri LankaSt. Kitts and NevisSt. LuciaSt. Vincent and the GrenadinesSudanSurinameSwazilandSwedenSwitzerlandSyrian Arab RepublicTajikistanTanzaniaThailandTimor-LesteTogoTongaTrinidad and TobagoTunisiaTurkeyTurkmenistanTuvaluUgandaUkraineUnited Arab EmiratesUnited KingdomUnited StatesUruguayUzbekistanVanuatuVenezuela, RBVietnamWest Bank and GazaZambiaZimbabwe Timeline:
This timeline shows a graph from 1981 to 2016 of Cabo Verde. No data until 1980. Number of actual observations by date: 36.
Source name:
World Development Indicators
Source organization:
World Bank national accounts data, and OECD National Accounts data files.
Categories, topics:
Economy & Growth
Last updated:
apr 23, 2017
Indicators value changes by year
Minimum:
9.163 bln
jan 1, 1981
Maximum:
91.244 bln
jan 1, 2016
At the date of observation
Value
Absolute change
Change from previous value
jan 1, 1981
9.163 bln
+9.163 bln
0.0%
jan 1, 1982
10.253 bln
+1.09 bln
11.9%
jan 1, 1983
11.205 bln
+952.082 mln
9.29%
jan 1, 1984
12.277 bln
+1.073 bln
9.57%
jan 1, 1985
12.912 bln
+634.809 mln
5.17%
jan 1, 1986
13.459 bln
+546.91 mln
4.24%
jan 1, 1987
13.773 bln
+313.938 mln
2.33%
jan 1, 1988
13.341 bln
-432.382 mln
-3.14%
jan 1, 1989
14.189 bln
+848.223 mln
6.36%
jan 1, 1990
15.111 bln
+922.584 mln
6.5%
jan 1, 1991
15.641 bln
+529.255 mln
3.5%
jan 1, 1992
16.062 bln
+421.345 mln
2.69%
jan 1, 1993
17.972 bln
+1.91 bln
11.89%
jan 1, 1994
19.384 bln
+1.412 bln
7.86%
jan 1, 1995
23.408 bln
+4.024 bln
20.76%
jan 1, 1996
26.995 bln
+3.587 bln
15.33%
jan 1, 1997
30.201 bln
+3.206 bln
11.88%
jan 1, 1998
35.036 bln
+4.835 bln
16.01%
jan 1, 1999
39.981 bln
+4.945 bln
14.11%
jan 1, 2000
43.878 bln
+3.897 bln
9.75%
jan 1, 2001
51.342 bln
+7.464 bln
17.01%
jan 1, 2002
54.979 bln
+3.638 bln
7.09%
jan 1, 2003
58.431 bln
+3.452 bln
6.28%
jan 1, 2004
61.453 bln
+3.022 bln
5.17%
jan 1, 2005
68.45 bln
+6.997 bln
11.39%
jan 1, 2006
73.413 bln
+4.963 bln
7.25%
jan 1, 2007
79.904 bln
+6.491 bln
8.84%
jan 1, 2008
74.355 bln
-5.55 bln
-6.95%
jan 1, 2009
77.544 bln
+3.19 bln
4.29%
jan 1, 2010
77.863 bln
+318.483 mln
0.41%
jan 1, 2011
80.447 bln
+2.584 bln
3.32%
jan 1, 2012
83.003 bln
+2.556 bln
3.18%
jan 1, 2013
86.177 bln
+3.174 bln
3.82%
jan 1, 2014
86.692 bln
+514.425 mln
0.6%
jan 1, 2015
89.925 bln
+3.234 bln
3.73%
jan 1, 2016
91.244 bln
+1.319 bln
1.47%
Ranking of countries by current statistics by years


Comments: