29
/
en
AIzaSyAYiBZKx7MnpbEhh9jyipgxe19OcubqV5w
April 1, 2024
275222
United Arab Emirates
ARE
true
2
1
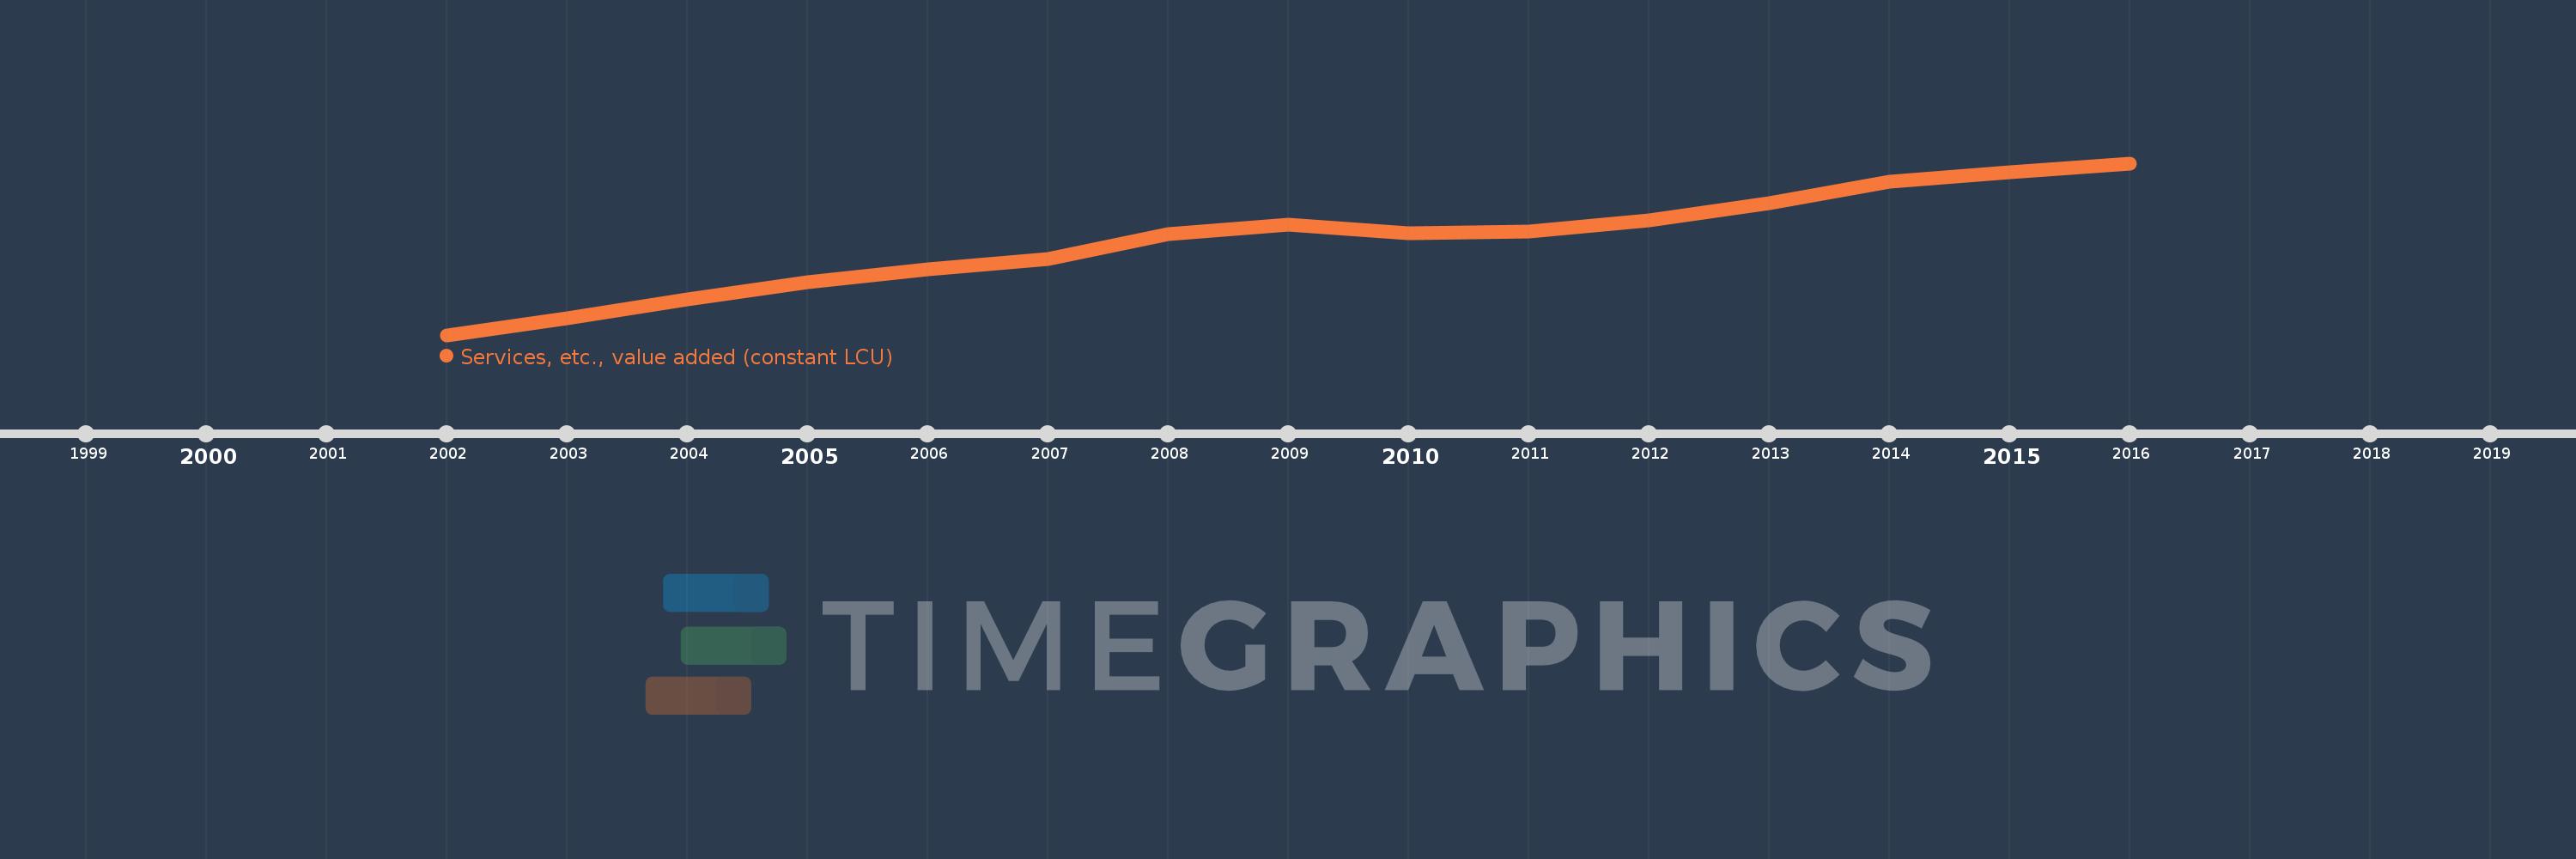
Services, etc., value added (constant LCU)
2016,2015,2014,2013,2012,2011,2010,2009,2008,2007,2006,2005,2004,2003,2002
This statistics in other country:
AfghanistanAlbaniaAlgeriaAntigua and BarbudaArgentinaArmeniaAustraliaAustriaAzerbaijanBahamas, TheBahrainBangladeshBelarusBelgiumBelizeBeninBermudaBhutanBoliviaBosnia and HerzegovinaBotswanaBrazilBrunei DarussalamBulgariaBurkina FasoBurundiCabo VerdeCambodiaCameroonCanadaCentral African RepublicChadChileChinaColombiaComorosCongo, Dem. Rep.Congo, Rep.Costa RicaCote d'IvoireCroatiaCubaCyprusCzech RepublicDenmarkDjiboutiDominicaDominican RepublicEcuadorEgypt, Arab Rep.El SalvadorEquatorial GuineaEritreaEstoniaEthiopiaFijiFinlandFranceGabonGambia, TheGeorgiaGermanyGhanaGreeceGrenadaGuatemalaGuineaGuinea-BissauGuyanaHaitiHondurasHong Kong SAR, ChinaHungaryIcelandIndiaIndonesiaIran, Islamic Rep.IraqIrelandItalyJamaicaJapanJordanKazakhstanKenyaKiribatiKorea, Rep.KosovoKuwaitKyrgyz RepublicLao PDRLatviaLebanonLesothoLiberiaLithuaniaLuxembourgMacedonia, FYRMadagascarMalawiMalaysiaMaldivesMaliMarshall IslandsMauritaniaMauritiusMexicoMicronesia, Fed. Sts.MoldovaMongoliaMontenegroMoroccoMozambiqueMyanmarNamibiaNepalNetherlandsNew ZealandNicaraguaNigerNigeriaNorwayOmanPakistanPalauPanamaPapua New GuineaParaguayPeruPhilippinesPolandPortugalPuerto RicoQatarRomaniaRussian FederationRwandaSamoaSao Tome and PrincipeSaudi ArabiaSenegalSerbiaSeychellesSierra LeoneSingaporeSlovak RepublicSloveniaSolomon IslandsSomaliaSouth AfricaSpainSri LankaSt. Kitts and NevisSt. LuciaSt. Vincent and the GrenadinesSudanSurinameSwazilandSwedenSwitzerlandSyrian Arab RepublicTajikistanTanzaniaThailandTimor-LesteTogoTongaTrinidad and TobagoTunisiaTurkeyTurkmenistanTuvaluUgandaUkraineUnited Arab EmiratesUnited KingdomUnited StatesUruguayUzbekistanVanuatuVenezuela, RBVietnamWest Bank and GazaZambiaZimbabwe Timeline:
This timeline shows a graph from 2002 to 2016 of United Arab Emirates. No data until 2001. Number of actual observations by date: 15.
Source name:
World Development Indicators
Source organization:
World Bank national accounts data, and OECD National Accounts data files.
Categories, topics:
Economy & Growth
Last updated:
apr 23, 2017
Indicators value changes by year
Minimum:
241.524 bln
jan 1, 2002
Maximum:
543.212 bln
jan 1, 2016
At the date of observation
Value
Absolute change
Change from previous value
jan 1, 2002
241.524 bln
+241.524 bln
0.0%
jan 1, 2003
271.508 bln
+29.984 bln
12.41%
jan 1, 2004
303.504 bln
+31.996 bln
11.78%
jan 1, 2005
334.733 bln
+31.229 bln
10.29%
jan 1, 2006
356.417 bln
+21.684 bln
6.48%
jan 1, 2007
375.103 bln
+18.686 bln
5.24%
jan 1, 2008
418.501 bln
+43.398 bln
11.57%
jan 1, 2009
435.854 bln
+17.353 bln
4.15%
jan 1, 2010
419.976 bln
-15.878 bln
-3.64%
jan 1, 2011
422.897 bln
+2.921 bln
0.7%
jan 1, 2012
443.374 bln
+20.477 bln
4.84%
jan 1, 2013
472.358 bln
+28.984 bln
6.54%
jan 1, 2014
510.055 bln
+37.697 bln
7.98%
jan 1, 2015
527.168 bln
+17.113 bln
3.36%
jan 1, 2016
543.212 bln
+16.044 bln
3.04%
Ranking of countries by current statistics by years


Comments: