29
/
en
AIzaSyAYiBZKx7MnpbEhh9jyipgxe19OcubqV5w
April 1, 2024
166857
Kazakhstan
KAZ
true
2
1
Services, etc., value added (constant LCU)
2016,2015,2014,2013,2012,2011,2010,2009,2008,2007,2006,2005,2004,2003,2002,2001,2000,1999,1998,1997,1996,1995,1994,1993,1992,1991
This statistics in other country:
AfghanistanAlbaniaAlgeriaAntigua and BarbudaArgentinaArmeniaAustraliaAustriaAzerbaijanBahamas, TheBahrainBangladeshBelarusBelgiumBelizeBeninBermudaBhutanBoliviaBosnia and HerzegovinaBotswanaBrazilBrunei DarussalamBulgariaBurkina FasoBurundiCabo VerdeCambodiaCameroonCanadaCentral African RepublicChadChileChinaColombiaComorosCongo, Dem. Rep.Congo, Rep.Costa RicaCote d'IvoireCroatiaCubaCyprusCzech RepublicDenmarkDjiboutiDominicaDominican RepublicEcuadorEgypt, Arab Rep.El SalvadorEquatorial GuineaEritreaEstoniaEthiopiaFijiFinlandFranceGabonGambia, TheGeorgiaGermanyGhanaGreeceGrenadaGuatemalaGuineaGuinea-BissauGuyanaHaitiHondurasHong Kong SAR, ChinaHungaryIcelandIndiaIndonesiaIran, Islamic Rep.IraqIrelandItalyJamaicaJapanJordanKazakhstanKenyaKiribatiKorea, Rep.KosovoKuwaitKyrgyz RepublicLao PDRLatviaLebanonLesothoLiberiaLithuaniaLuxembourgMacedonia, FYRMadagascarMalawiMalaysiaMaldivesMaliMarshall IslandsMauritaniaMauritiusMexicoMicronesia, Fed. Sts.MoldovaMongoliaMontenegroMoroccoMozambiqueMyanmarNamibiaNepalNetherlandsNew ZealandNicaraguaNigerNigeriaNorwayOmanPakistanPalauPanamaPapua New GuineaParaguayPeruPhilippinesPolandPortugalPuerto RicoQatarRomaniaRussian FederationRwandaSamoaSao Tome and PrincipeSaudi ArabiaSenegalSerbiaSeychellesSierra LeoneSingaporeSlovak RepublicSloveniaSolomon IslandsSomaliaSouth AfricaSpainSri LankaSt. Kitts and NevisSt. LuciaSt. Vincent and the GrenadinesSudanSurinameSwazilandSwedenSwitzerlandSyrian Arab RepublicTajikistanTanzaniaThailandTimor-LesteTogoTongaTrinidad and TobagoTunisiaTurkeyTurkmenistanTuvaluUgandaUkraineUnited Arab EmiratesUnited KingdomUnited StatesUruguayUzbekistanVanuatuVenezuela, RBVietnamWest Bank and GazaZambiaZimbabwe Timeline:
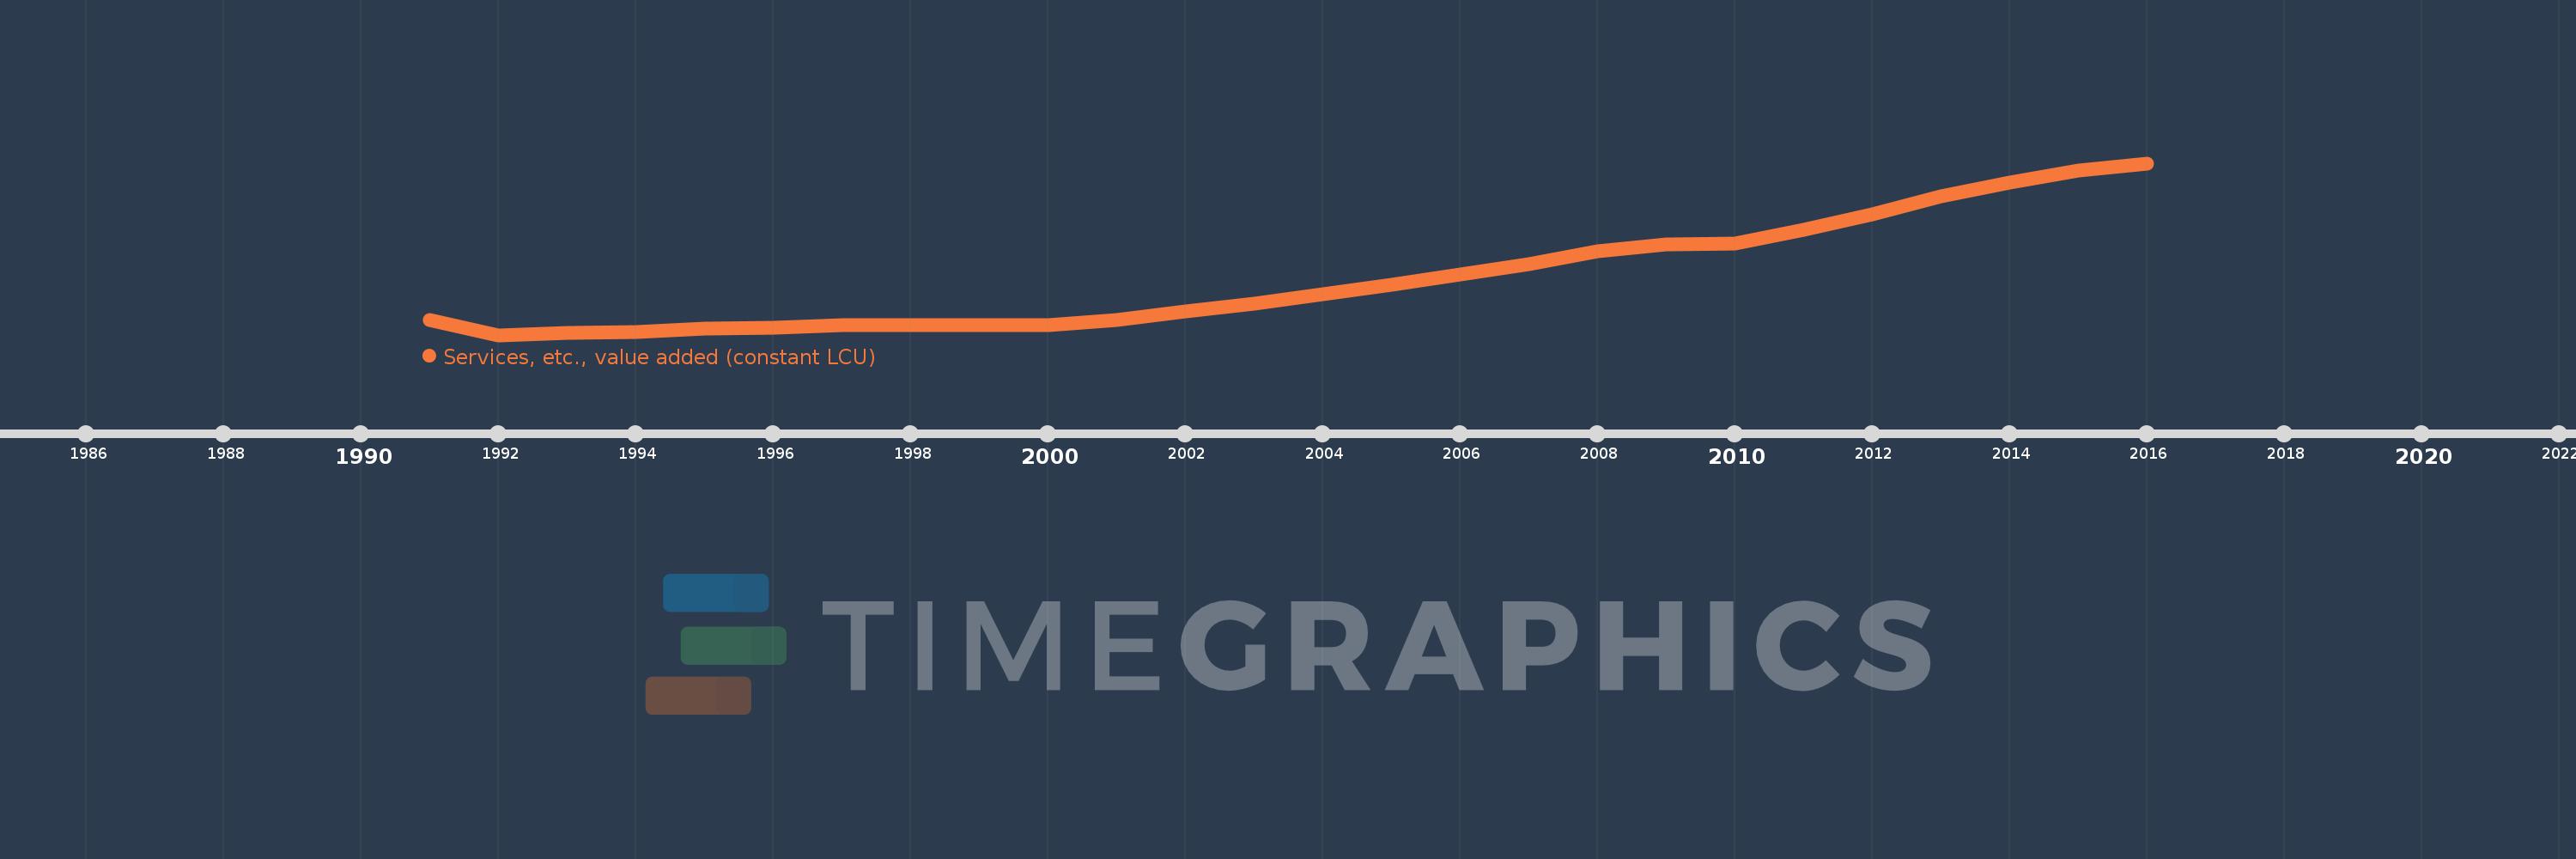
This timeline shows a graph from 1991 to 2016 of Kazakhstan. No data until 1990. Number of actual observations by date: 26.
Source name:
World Development Indicators
Source organization:
World Bank national accounts data, and OECD National Accounts data files.
Categories, topics:
Economy & Growth
Last updated:
apr 23, 2017
Indicators value changes by year
Minimum:
1.875 trl
jan 1, 1992
Maximum:
7.318 trl
jan 1, 2016
At the date of observation
Value
Absolute change
Change from previous value
jan 1, 1991
2.361 trl
+2.361 trl
0.0%
jan 1, 1992
1.875 trl
-486.456 bln
-20.6%
jan 1, 1993
1.949 trl
+74.356 bln
3.97%
jan 1, 1994
1.957 trl
+8.119 bln
0.42%
jan 1, 1995
2.09 trl
+132.465 bln
6.77%
jan 1, 1996
2.099 trl
+9.453 bln
0.45%
jan 1, 1997
2.18 trl
+81.436 bln
3.88%
jan 1, 1998
2.187 trl
+6.516 bln
0.3%
jan 1, 1999
2.194 trl
+7.188 bln
0.33%
jan 1, 2000
2.178 trl
-16.187 bln
-0.74%
jan 1, 2001
2.357 trl
+178.777 bln
8.21%
jan 1, 2002
2.624 trl
+267.588 bln
11.35%
jan 1, 2003
2.865 trl
+240.643 bln
9.17%
jan 1, 2004
3.167 trl
+302.336 bln
10.55%
jan 1, 2005
3.476 trl
+308.584 bln
9.74%
jan 1, 2006
3.783 trl
+307.223 bln
8.84%
jan 1, 2007
4.127 trl
+344.359 bln
9.1%
jan 1, 2008
4.517 trl
+389.163 bln
9.43%
jan 1, 2009
4.745 trl
+228.545 bln
5.06%
jan 1, 2010
4.764 trl
+18.381 bln
0.39%
jan 1, 2011
5.22 trl
+456.34 bln
9.58%
jan 1, 2012
5.69 trl
+469.787 bln
9.0%
jan 1, 2013
6.281 trl
+591.723 bln
10.4%
jan 1, 2014
6.715 trl
+433.414 bln
6.9%
jan 1, 2015
7.098 trl
+382.743 bln
5.7%
jan 1, 2016
7.318 trl
+220.023 bln
3.1%
Ranking of countries by current statistics by years


Comments: