29
/
en
AIzaSyAYiBZKx7MnpbEhh9jyipgxe19OcubqV5w
April 1, 2024
159896
Ireland
IRL
true
2
1
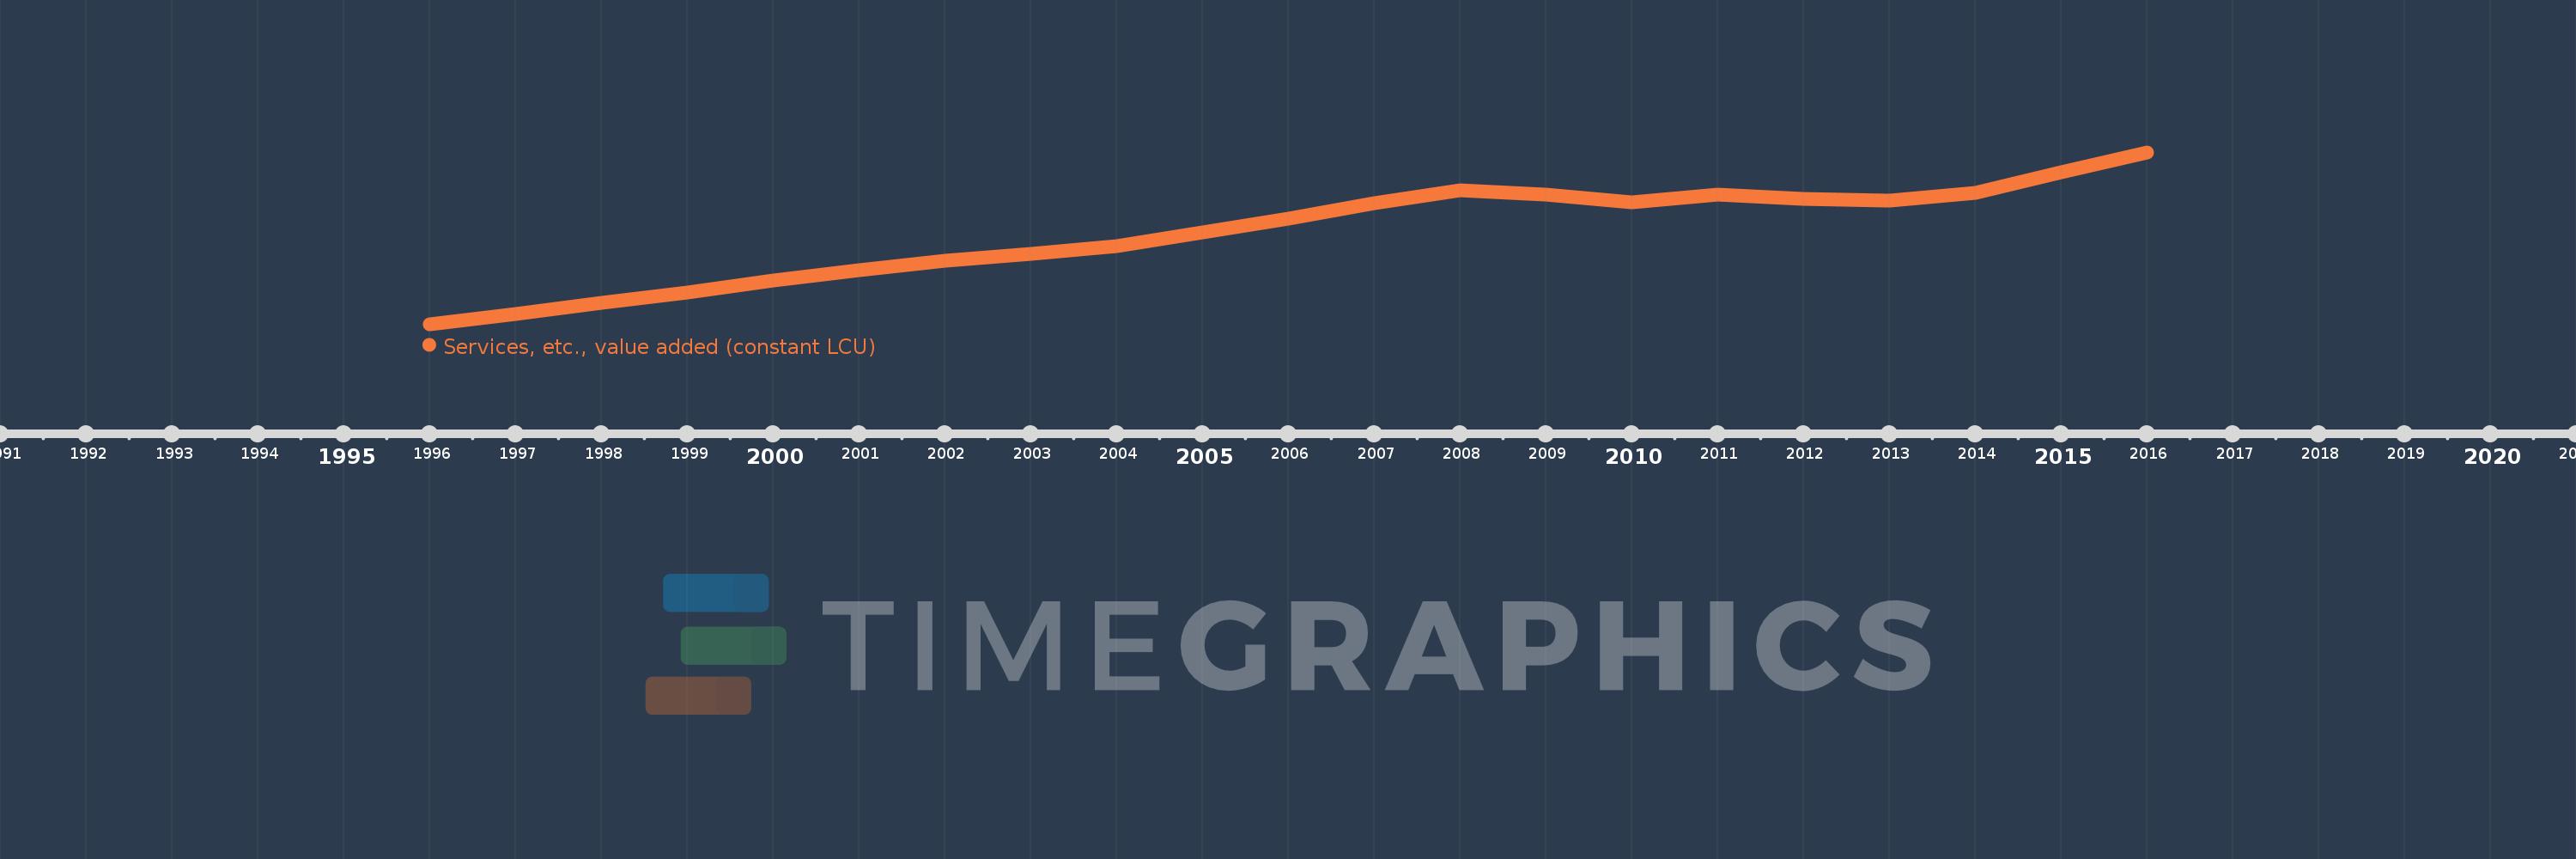
Services, etc., value added (constant LCU)
2016,2015,2014,2013,2012,2011,2010,2009,2008,2007,2006,2005,2004,2003,2002,2001,2000,1999,1998,1997,1996
This statistics in other country:
AfghanistanAlbaniaAlgeriaAntigua and BarbudaArgentinaArmeniaAustraliaAustriaAzerbaijanBahamas, TheBahrainBangladeshBelarusBelgiumBelizeBeninBermudaBhutanBoliviaBosnia and HerzegovinaBotswanaBrazilBrunei DarussalamBulgariaBurkina FasoBurundiCabo VerdeCambodiaCameroonCanadaCentral African RepublicChadChileChinaColombiaComorosCongo, Dem. Rep.Congo, Rep.Costa RicaCote d'IvoireCroatiaCubaCyprusCzech RepublicDenmarkDjiboutiDominicaDominican RepublicEcuadorEgypt, Arab Rep.El SalvadorEquatorial GuineaEritreaEstoniaEthiopiaFijiFinlandFranceGabonGambia, TheGeorgiaGermanyGhanaGreeceGrenadaGuatemalaGuineaGuinea-BissauGuyanaHaitiHondurasHong Kong SAR, ChinaHungaryIcelandIndiaIndonesiaIran, Islamic Rep.IraqIrelandItalyJamaicaJapanJordanKazakhstanKenyaKiribatiKorea, Rep.KosovoKuwaitKyrgyz RepublicLao PDRLatviaLebanonLesothoLiberiaLithuaniaLuxembourgMacedonia, FYRMadagascarMalawiMalaysiaMaldivesMaliMarshall IslandsMauritaniaMauritiusMexicoMicronesia, Fed. Sts.MoldovaMongoliaMontenegroMoroccoMozambiqueMyanmarNamibiaNepalNetherlandsNew ZealandNicaraguaNigerNigeriaNorwayOmanPakistanPalauPanamaPapua New GuineaParaguayPeruPhilippinesPolandPortugalPuerto RicoQatarRomaniaRussian FederationRwandaSamoaSao Tome and PrincipeSaudi ArabiaSenegalSerbiaSeychellesSierra LeoneSingaporeSlovak RepublicSloveniaSolomon IslandsSomaliaSouth AfricaSpainSri LankaSt. Kitts and NevisSt. LuciaSt. Vincent and the GrenadinesSudanSurinameSwazilandSwedenSwitzerlandSyrian Arab RepublicTajikistanTanzaniaThailandTimor-LesteTogoTongaTrinidad and TobagoTunisiaTurkeyTurkmenistanTuvaluUgandaUkraineUnited Arab EmiratesUnited KingdomUnited StatesUruguayUzbekistanVanuatuVenezuela, RBVietnamWest Bank and GazaZambiaZimbabwe Timeline:
This timeline shows a graph from 1996 to 2016 of Ireland. No data until 1995. Number of actual observations by date: 21.
Source name:
World Development Indicators
Source organization:
World Bank national accounts data, and OECD National Accounts data files.
Categories, topics:
Economy & Growth
Last updated:
apr 23, 2017
Indicators value changes by year
Minimum:
48.932 bln
jan 1, 1996
Maximum:
130.936 bln
jan 1, 2016
At the date of observation
Value
Absolute change
Change from previous value
jan 1, 1996
48.932 bln
+48.932 bln
0.0%
jan 1, 1997
53.937 bln
+5.005 bln
10.23%
jan 1, 1998
59.324 bln
+5.387 bln
9.99%
jan 1, 1999
64.021 bln
+4.697 bln
7.92%
jan 1, 2000
69.712 bln
+5.691 bln
8.89%
jan 1, 2001
74.804 bln
+5.092 bln
7.3%
jan 1, 2002
79.113 bln
+4.309 bln
5.76%
jan 1, 2003
82.643 bln
+3.531 bln
4.46%
jan 1, 2004
86.179 bln
+3.536 bln
4.28%
jan 1, 2005
92.7 bln
+6.521 bln
7.57%
jan 1, 2006
99.273 bln
+6.573 bln
7.09%
jan 1, 2007
106.67 bln
+7.397 bln
7.45%
jan 1, 2008
112.8 bln
+6.13 bln
5.75%
jan 1, 2009
110.733 bln
-2.067 bln
-1.83%
jan 1, 2010
107.223 bln
-3.51 bln
-3.17%
jan 1, 2011
110.698 bln
+3.475 bln
3.24%
jan 1, 2012
108.897 bln
-1.801 bln
-1.63%
jan 1, 2013
107.99 bln
-907.9 mln
-0.83%
jan 1, 2014
111.664 bln
+3.674 bln
3.4%
jan 1, 2015
121.504 bln
+9.84 bln
8.81%
jan 1, 2016
130.936 bln
+9.432 bln
7.76%
Ranking of countries by current statistics by years


Comments: