29
/
en
AIzaSyAYiBZKx7MnpbEhh9jyipgxe19OcubqV5w
April 1, 2024
228506
Romania
ROU
true
2
1
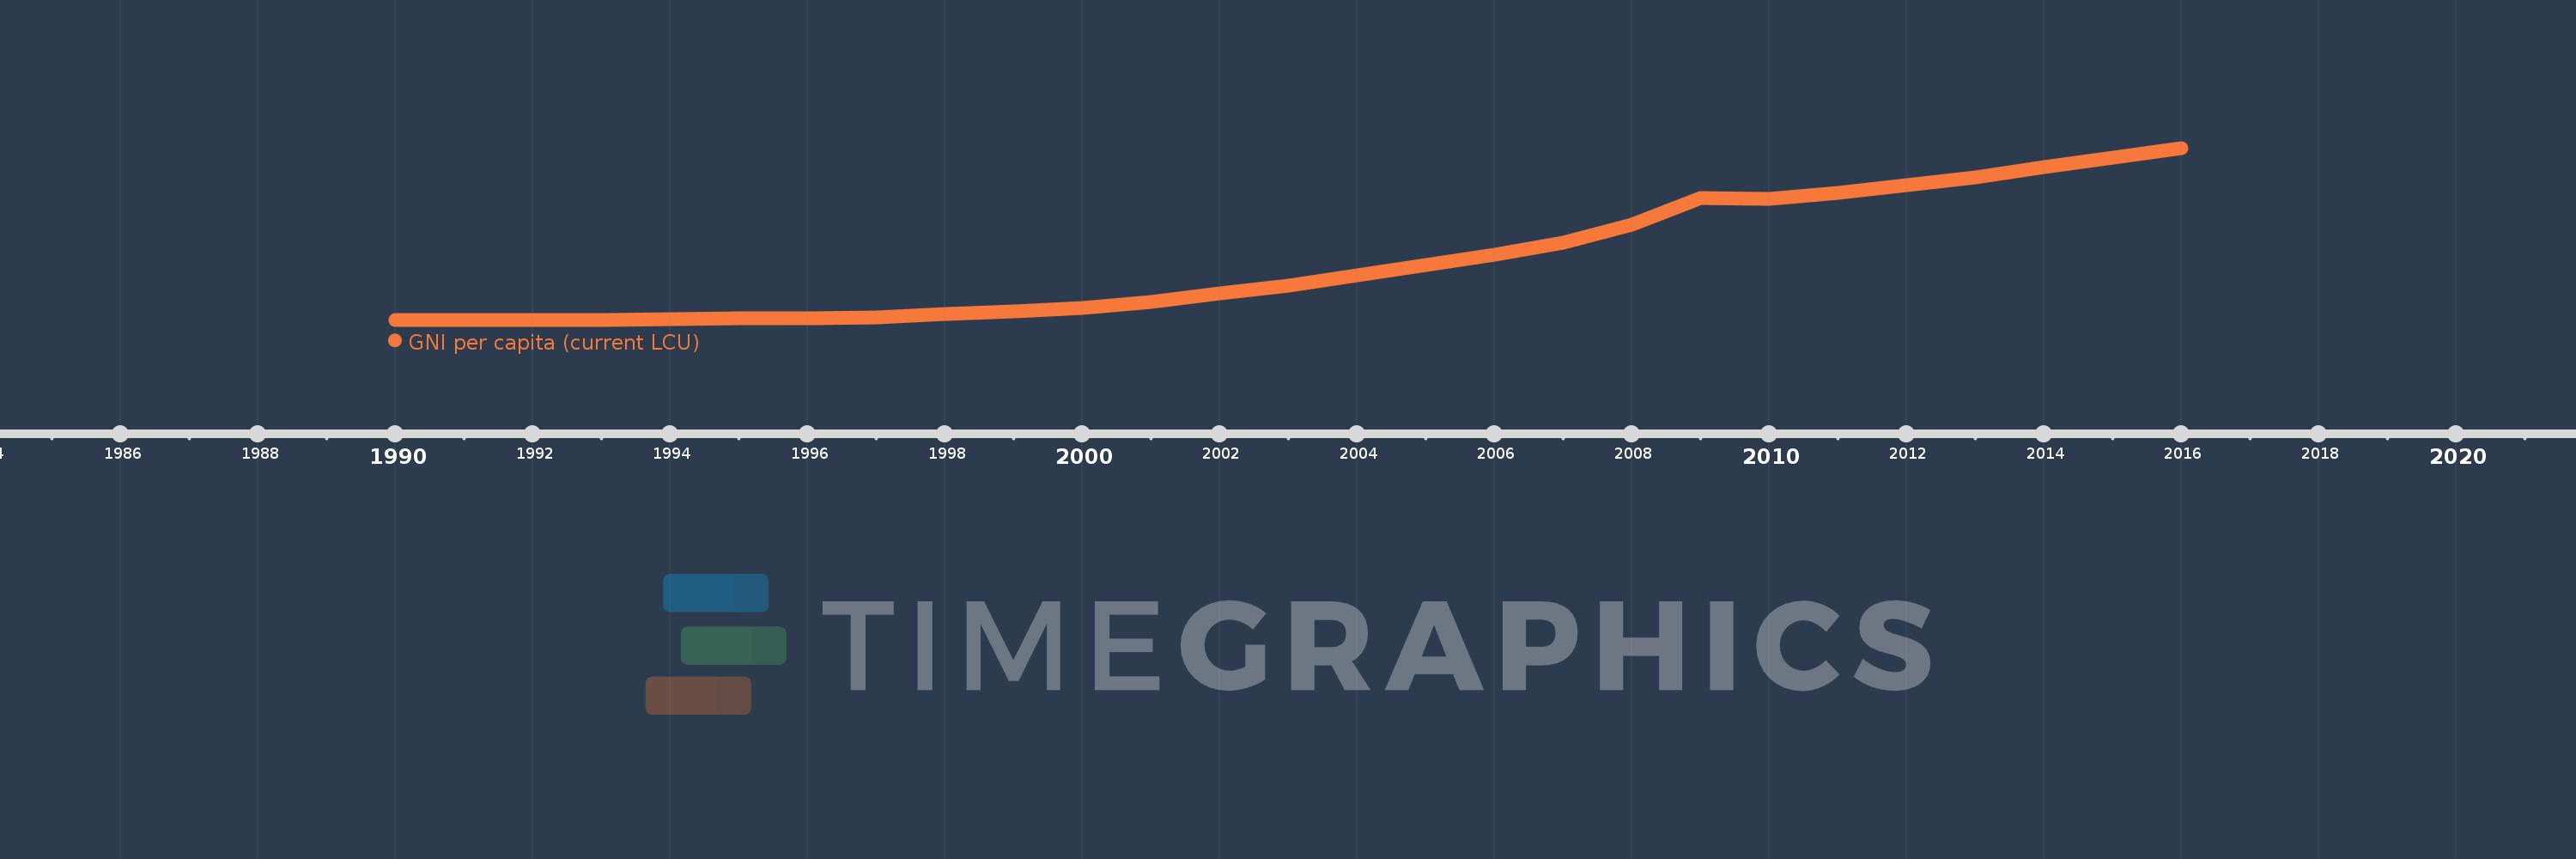
GNI per capita (current LCU)
2016,2015,2014,2013,2012,2011,2010,2009,2008,2007,2006,2005,2004,2003,2002,2001,2000,1999,1998,1997,1996,1995,1994,1993,1992,1991,1990
This statistics in other country:
AfghanistanAlbaniaAlgeriaAmerican SamoaAndorraAngolaAntigua and BarbudaArgentinaArmeniaAustraliaAustriaAzerbaijanBahamas, TheBahrainBangladeshBarbadosBelarusBelgiumBelizeBeninBermudaBhutanBoliviaBosnia and HerzegovinaBotswanaBrazilBrunei DarussalamBulgariaBurkina FasoBurundiCabo VerdeCambodiaCameroonCanadaCentral African RepublicChadChannel IslandsChileChinaColombiaComorosCongo, Dem. Rep.Congo, Rep.Costa RicaCote d'IvoireCroatiaCubaCyprusCzech RepublicDenmarkDjiboutiDominicaDominican RepublicEcuadorEgypt, Arab Rep.El SalvadorEquatorial GuineaEritreaEstoniaEthiopiaFaroe IslandsFijiFinlandFranceFrench PolynesiaGabonGambia, TheGeorgiaGermanyGhanaGreeceGreenlandGrenadaGuamGuatemalaGuineaGuinea-BissauGuyanaHaitiHondurasHong Kong SAR, ChinaHungaryIcelandIndiaIndonesiaIran, Islamic Rep.IraqIrelandIsle of ManIsraelItalyJamaicaJapanJordanKazakhstanKenyaKiribatiKorea, Rep.KosovoKuwaitKyrgyz RepublicLao PDRLatviaLebanonLesothoLiberiaLibyaLiechtensteinLithuaniaLuxembourgMacao SAR, ChinaMacedonia, FYRMadagascarMalawiMalaysiaMaldivesMaliMaltaMarshall IslandsMauritaniaMauritiusMexicoMicronesia, Fed. Sts.MoldovaMonacoMongoliaMontenegroMoroccoMozambiqueMyanmarNamibiaNauruNepalNetherlandsNew CaledoniaNew ZealandNicaraguaNigerNigeriaNorwayOmanPakistanPalauPanamaPapua New GuineaParaguayPeruPhilippinesPolandPortugalPuerto RicoQatarRomaniaRussian FederationRwandaSamoaSan MarinoSao Tome and PrincipeSaudi ArabiaSenegalSerbiaSeychellesSierra LeoneSingaporeSlovak RepublicSloveniaSolomon IslandsSomaliaSouth AfricaSouth SudanSpainSri LankaSt. Kitts and NevisSt. LuciaSt. Vincent and the GrenadinesSudanSurinameSwazilandSwedenSwitzerlandSyrian Arab RepublicTajikistanTanzaniaThailandTimor-LesteTogoTongaTrinidad and TobagoTunisiaTurkeyTurkmenistanTuvaluUgandaUkraineUnited Arab EmiratesUnited KingdomUnited StatesUruguayUzbekistanVanuatuVenezuela, RBVietnamVirgin Islands (U.S.)West Bank and GazaYemen, Rep.ZambiaZimbabwe Timeline:
This timeline shows a graph from 1990 to 2016 of Romania. No data until 1989. Number of actual observations by date: 27.
Source name:
World Development Indicators
Source organization:
World Bank national accounts data, and OECD National Accounts data files.
Categories, topics:
Economy & Growth
Last updated:
apr 23, 2017
Indicators value changes by year
Maximum:
35.106K
jan 1, 2016
At the date of observation
Value
Absolute change
Change from previous value
jan 1, 1990
3.461
+3.461
0.0%
jan 1, 1991
3.684
+0.223
6.45%
jan 1, 1992
9.587
+5.903
160.22%
jan 1, 1993
26.356
+16.769
174.92%
jan 1, 1994
87.534
+61.178
232.13%
jan 1, 1995
218.034
+130.501
149.09%
jan 1, 1996
335.373
+117.339
53.82%
jan 1, 1997
502.608
+167.235
49.87%
jan 1, 1998
1.129K
+626.155
124.58%
jan 1, 1999
1.636K
+506.986
44.92%
jan 1, 2000
2.439K
+803.266
49.11%
jan 1, 2001
3.596K
+1.157K
47.44%
jan 1, 2002
5.313K
+1.717K
47.75%
jan 1, 2003
6.954K
+1.64K
30.87%
jan 1, 2004
9.005K
+2.051K
29.5%
jan 1, 2005
11.117K
+2.112K
23.45%
jan 1, 2006
13.23K
+2.113K
19.01%
jan 1, 2007
15.833K
+2.603K
19.68%
jan 1, 2008
19.369K
+3.536K
22.33%
jan 1, 2009
24.872K
+5.503K
28.41%
jan 1, 2010
24.67K
-202.475
-0.81%
jan 1, 2011
25.971K
+1.301K
5.27%
jan 1, 2012
27.584K
+1.613K
6.21%
jan 1, 2013
29.17K
+1.587K
5.75%
jan 1, 2014
31.211K
+2.04K
6.99%
jan 1, 2015
33.135K
+1.924K
6.17%
jan 1, 2016
35.106K
+1.971K
5.95%
Ranking of countries by current statistics by years


Comments: