29
/
en
AIzaSyAYiBZKx7MnpbEhh9jyipgxe19OcubqV5w
April 1, 2024
109694
Congo, Dem. Rep.
COD
true
2
1
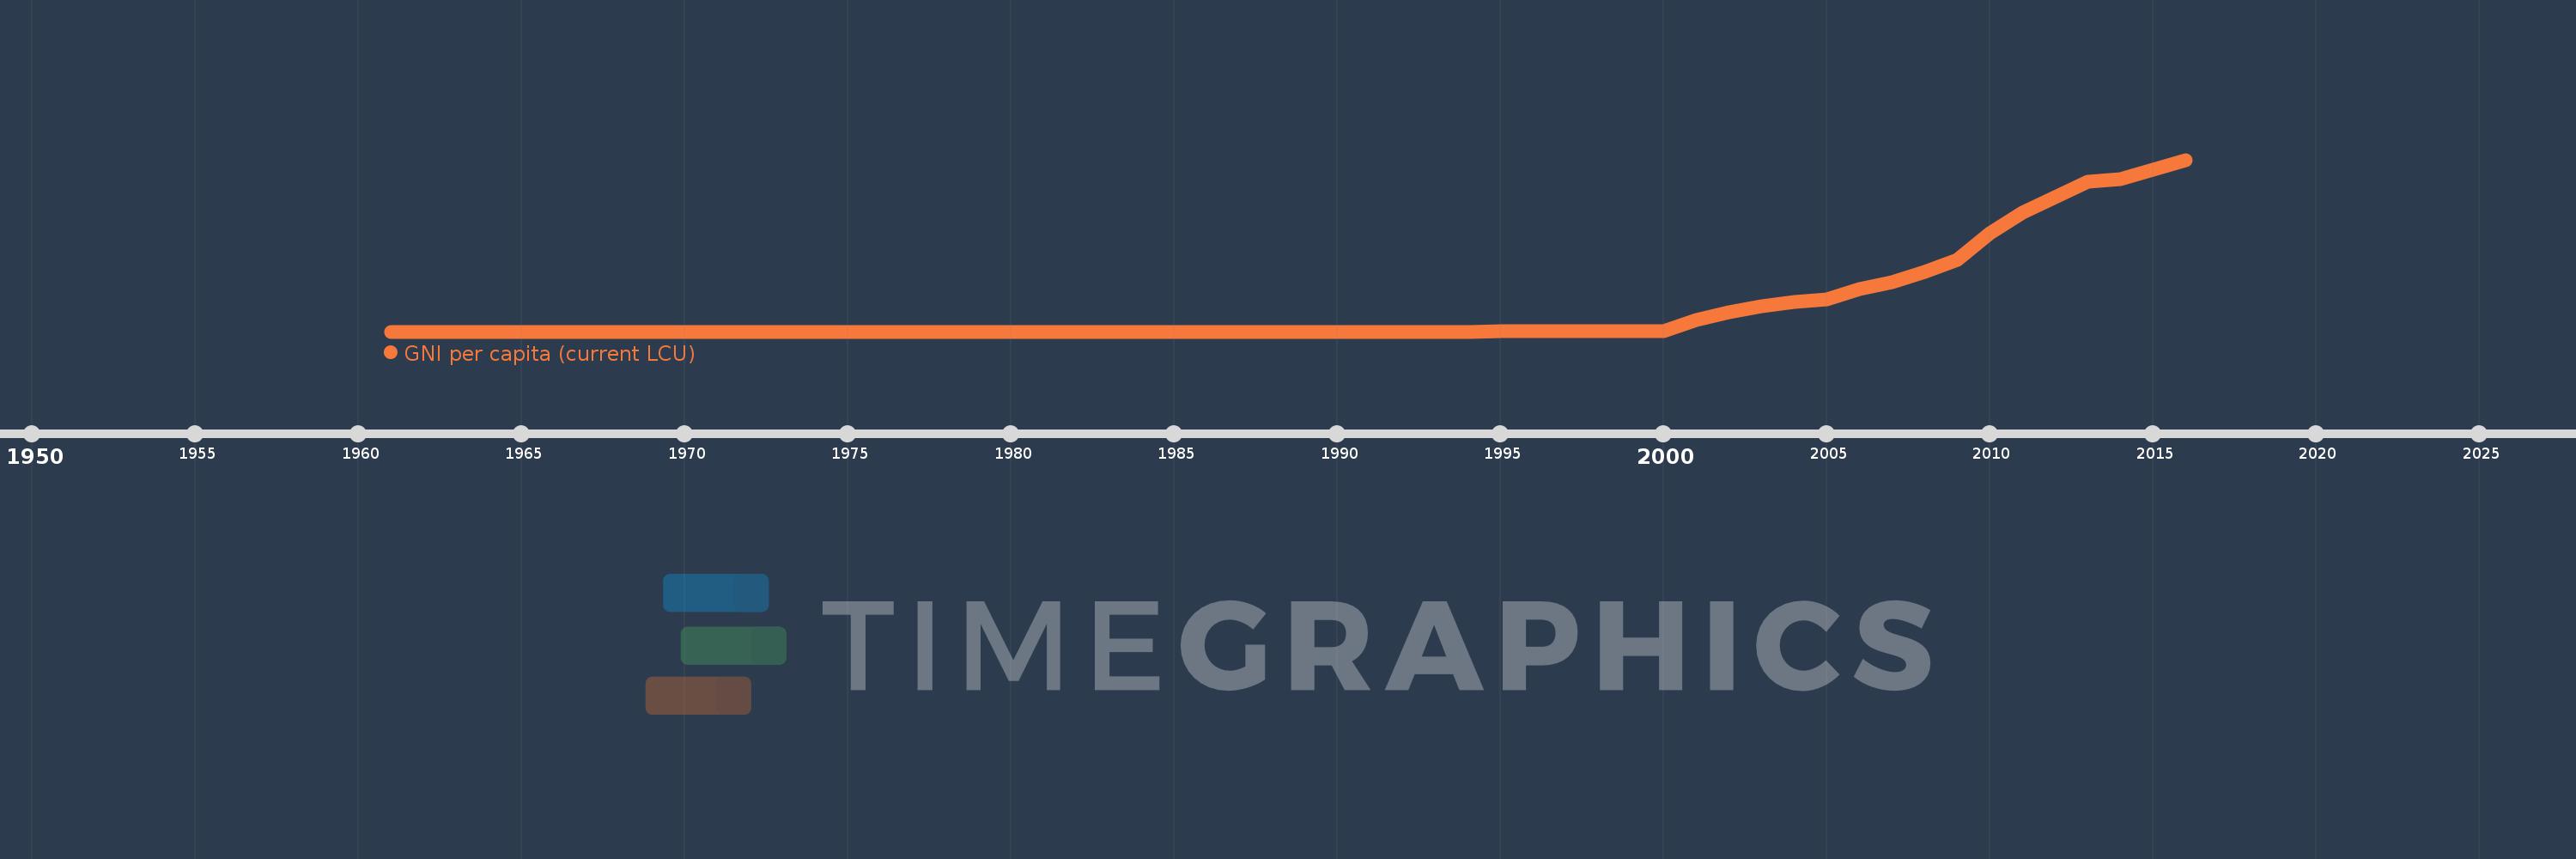
GNI per capita (current LCU)
2016,2015,2014,2013,2012,2011,2010,2009,2008,2007,2006,2005,2004,2003,2002,2001,2000,1999,1998,1997,1996,1995,1994,1993,1992,1991,1990,1989,1988,1987,1986,1985,1984,1983,1982,1981,1980,1979,1978,1977,1976,1975,1974,1973,1972,1971,1970,1969,1968,1967,1966,1965,1964,1963,1962,1961
This statistics in other country:
AfghanistanAlbaniaAlgeriaAmerican SamoaAndorraAngolaAntigua and BarbudaArgentinaArmeniaAustraliaAustriaAzerbaijanBahamas, TheBahrainBangladeshBarbadosBelarusBelgiumBelizeBeninBermudaBhutanBoliviaBosnia and HerzegovinaBotswanaBrazilBrunei DarussalamBulgariaBurkina FasoBurundiCabo VerdeCambodiaCameroonCanadaCentral African RepublicChadChannel IslandsChileChinaColombiaComorosCongo, Dem. Rep.Congo, Rep.Costa RicaCote d'IvoireCroatiaCubaCyprusCzech RepublicDenmarkDjiboutiDominicaDominican RepublicEcuadorEgypt, Arab Rep.El SalvadorEquatorial GuineaEritreaEstoniaEthiopiaFaroe IslandsFijiFinlandFranceFrench PolynesiaGabonGambia, TheGeorgiaGermanyGhanaGreeceGreenlandGrenadaGuamGuatemalaGuineaGuinea-BissauGuyanaHaitiHondurasHong Kong SAR, ChinaHungaryIcelandIndiaIndonesiaIran, Islamic Rep.IraqIrelandIsle of ManIsraelItalyJamaicaJapanJordanKazakhstanKenyaKiribatiKorea, Rep.KosovoKuwaitKyrgyz RepublicLao PDRLatviaLebanonLesothoLiberiaLibyaLiechtensteinLithuaniaLuxembourgMacao SAR, ChinaMacedonia, FYRMadagascarMalawiMalaysiaMaldivesMaliMaltaMarshall IslandsMauritaniaMauritiusMexicoMicronesia, Fed. Sts.MoldovaMonacoMongoliaMontenegroMoroccoMozambiqueMyanmarNamibiaNauruNepalNetherlandsNew CaledoniaNew ZealandNicaraguaNigerNigeriaNorwayOmanPakistanPalauPanamaPapua New GuineaParaguayPeruPhilippinesPolandPortugalPuerto RicoQatarRomaniaRussian FederationRwandaSamoaSan MarinoSao Tome and PrincipeSaudi ArabiaSenegalSerbiaSeychellesSierra LeoneSingaporeSlovak RepublicSloveniaSolomon IslandsSomaliaSouth AfricaSouth SudanSpainSri LankaSt. Kitts and NevisSt. LuciaSt. Vincent and the GrenadinesSudanSurinameSwazilandSwedenSwitzerlandSyrian Arab RepublicTajikistanTanzaniaThailandTimor-LesteTogoTongaTrinidad and TobagoTunisiaTurkeyTurkmenistanTuvaluUgandaUkraineUnited Arab EmiratesUnited KingdomUnited StatesUruguayUzbekistanVanuatuVenezuela, RBVietnamVirgin Islands (U.S.)West Bank and GazaYemen, Rep.ZambiaZimbabwe Timeline:
This timeline shows a graph from 1961 to 2016 of Congo, Dem. Rep.. No data until 1960. Number of actual observations by date: 56.
Source name:
World Development Indicators
Source organization:
World Bank national accounts data, and OECD National Accounts data files.
Categories, topics:
Economy & Growth
Last updated:
apr 23, 2017
Indicators value changes by year
Maximum:
388.851K
jan 1, 2016
At the date of observation
Value
Absolute change
Change from previous value
jan 1, 1962
0.0
0.0
-8.06%
jan 1, 1963
0.0
+0.0
45.84%
jan 1, 1964
0.0
+0.0
91.98%
jan 1, 1965
0.0
+0.0
0.42%
jan 1, 1966
0.0
+0.0
37.22%
jan 1, 1968
0.0
+0.0
52.68%
jan 1, 1969
0.0
+0.0
61.93%
jan 1, 1970
0.0
+0.0
24.96%
jan 1, 1971
0.0
0.0
-5.73%
jan 1, 1972
0.0
+0.0
11.61%
jan 1, 1974
0.0
+0.0
24.24%
jan 1, 1975
0.0
+0.0
18.68%
jan 1, 1976
0.0
+0.0
3.45%
jan 1, 1977
0.0
+0.0
43.49%
jan 1, 1978
0.0
+0.0
33.22%
jan 1, 1979
0.0
+0.0
20.32%
jan 1, 1980
0.0
+0.0
96.29%
jan 1, 1981
0.0
+0.0
48.91%
jan 1, 1982
0.0
+0.0
31.89%
jan 1, 1983
0.0
+0.0
38.75%
jan 1, 1984
0.0
+0.0
76.71%
jan 1, 1985
0.0
+0.0
95.24%
jan 1, 1986
0.0
+0.0
19.97%
jan 1, 1987
0.0
+0.0
36.16%
jan 1, 1988
0.0
+0.0
60.92%
jan 1, 1989
0.0
+0.0
86.73%
jan 1, 1990
0.0
+0.0
103.78%
jan 1, 1991
0.0
+0.0
86.41%
jan 1, 1992
0.0
+0.0
1.93K%
jan 1, 1993
0.0
+0.0
3.48K%
jan 1, 1994
0.006
+0.006
1.41K%
jan 1, 1995
1.501
+1.495
23.22K%
jan 1, 1996
8.122
+6.621
440.96%
jan 1, 1997
62.388
+54.266
668.11%
jan 1, 1998
167.572
+105.184
168.6%
jan 1, 1999
205.085
+37.513
22.39%
jan 1, 2000
1.007K
+801.497
390.81%
jan 1, 2001
26.854K
+25.847K
2.57K%
jan 1, 2002
42.843K
+15.989K
59.54%
jan 1, 2003
57.34K
+14.497K
33.84%
jan 1, 2004
67.134K
+9.794K
17.08%
jan 1, 2005
73.47K
+6.336K
9.44%
jan 1, 2006
96.802K
+23.332K
31.76%
jan 1, 2007
111.776K
+14.974K
15.47%
jan 1, 2008
135.847K
+24.071K
21.54%
jan 1, 2009
161.756K
+25.909K
19.07%
jan 1, 2010
221.671K
+59.915K
37.04%
jan 1, 2011
269.451K
+47.78K
21.55%
jan 1, 2012
304.563K
+35.112K
13.03%
jan 1, 2013
338.469K
+33.906K
11.13%
jan 1, 2014
344.885K
+6.417K
1.9%
jan 1, 2015
367.417K
+22.532K
6.53%
jan 1, 2016
388.851K
+21.434K
5.83%
Ranking of countries by current statistics by years


Comments: