29
/
en
AIzaSyAYiBZKx7MnpbEhh9jyipgxe19OcubqV5w
April 1, 2024
88571
Bosnia and Herzegovina
BIH
true
2
1
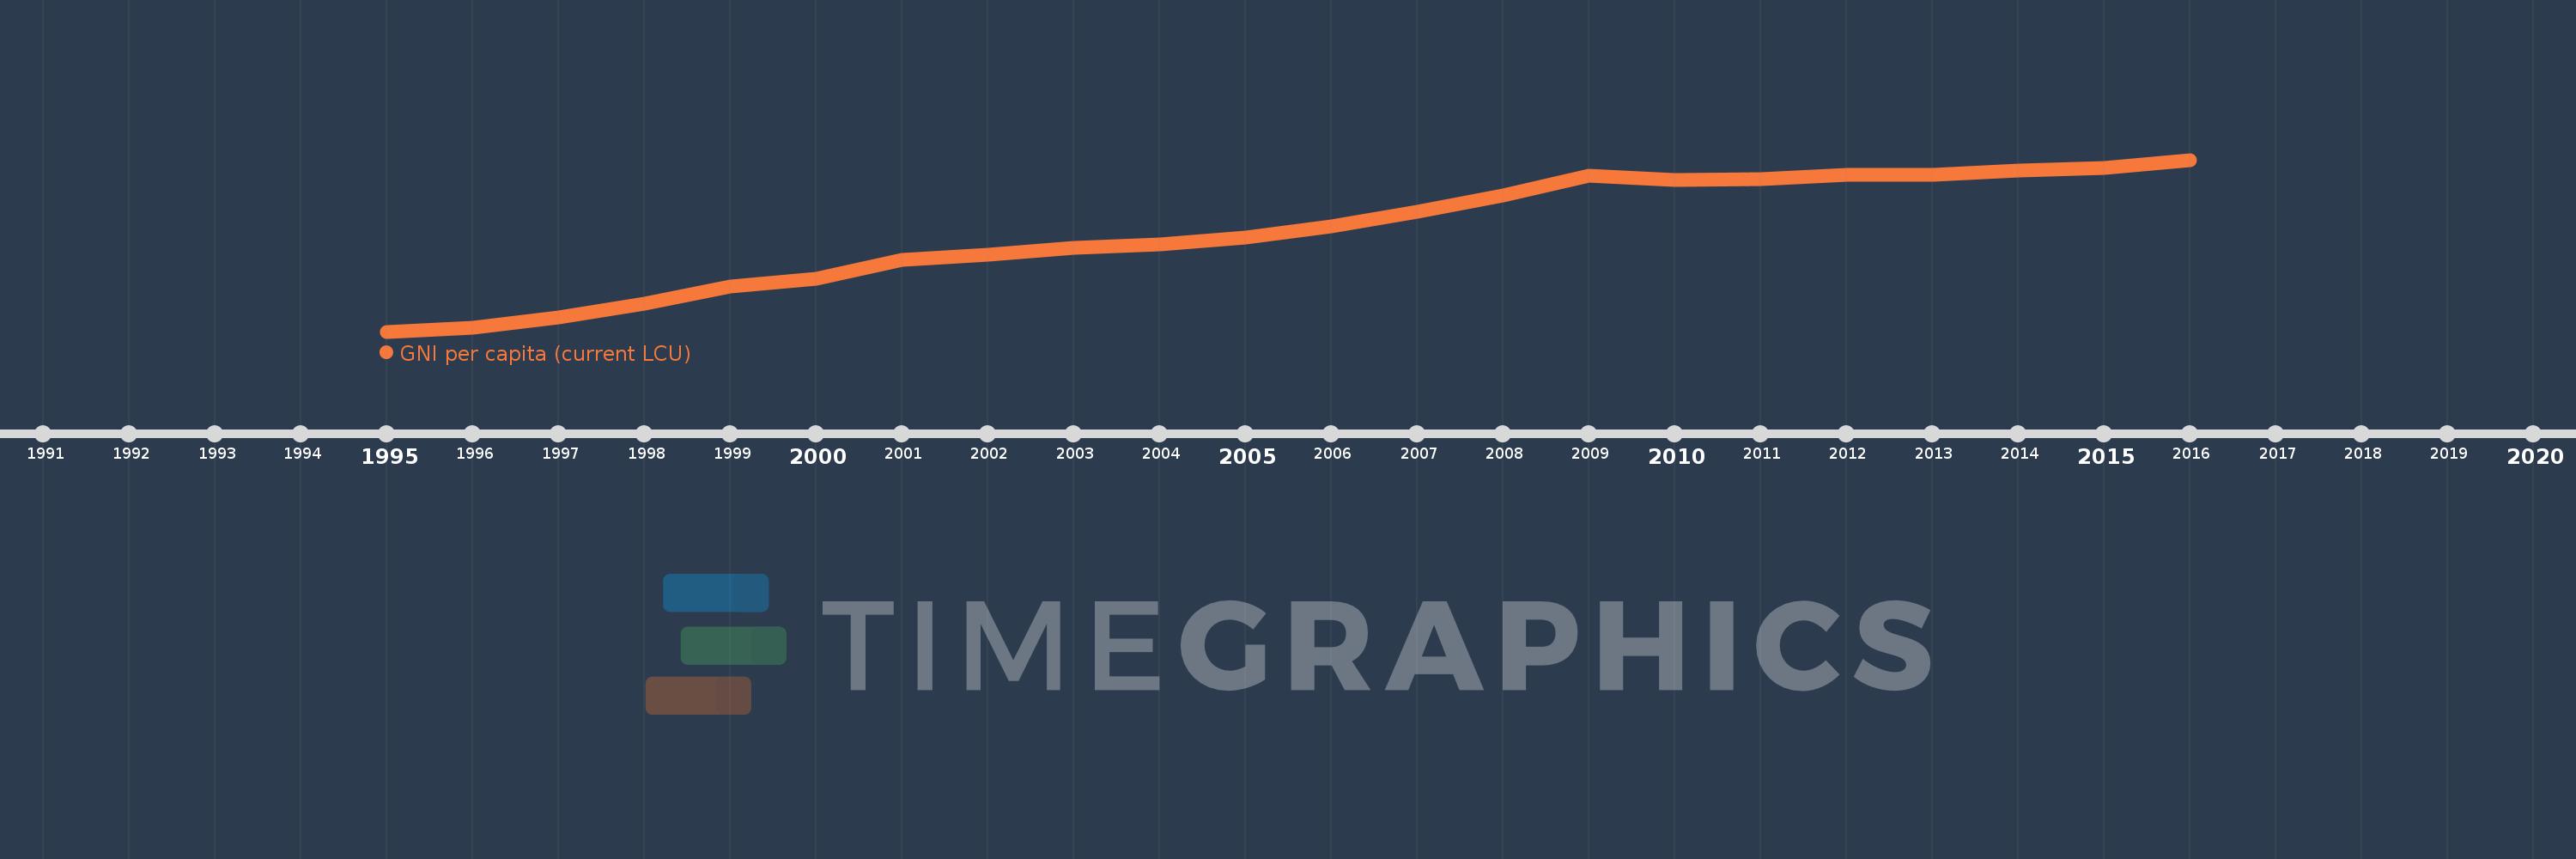
GNI per capita (current LCU)
2016,2015,2014,2013,2012,2011,2010,2009,2008,2007,2006,2005,2004,2003,2002,2001,2000,1999,1998,1997,1996,1995
This statistics in other country:
AfghanistanAlbaniaAlgeriaAmerican SamoaAndorraAngolaAntigua and BarbudaArgentinaArmeniaAustraliaAustriaAzerbaijanBahamas, TheBahrainBangladeshBarbadosBelarusBelgiumBelizeBeninBermudaBhutanBoliviaBosnia and HerzegovinaBotswanaBrazilBrunei DarussalamBulgariaBurkina FasoBurundiCabo VerdeCambodiaCameroonCanadaCentral African RepublicChadChannel IslandsChileChinaColombiaComorosCongo, Dem. Rep.Congo, Rep.Costa RicaCote d'IvoireCroatiaCubaCyprusCzech RepublicDenmarkDjiboutiDominicaDominican RepublicEcuadorEgypt, Arab Rep.El SalvadorEquatorial GuineaEritreaEstoniaEthiopiaFaroe IslandsFijiFinlandFranceFrench PolynesiaGabonGambia, TheGeorgiaGermanyGhanaGreeceGreenlandGrenadaGuamGuatemalaGuineaGuinea-BissauGuyanaHaitiHondurasHong Kong SAR, ChinaHungaryIcelandIndiaIndonesiaIran, Islamic Rep.IraqIrelandIsle of ManIsraelItalyJamaicaJapanJordanKazakhstanKenyaKiribatiKorea, Rep.KosovoKuwaitKyrgyz RepublicLao PDRLatviaLebanonLesothoLiberiaLibyaLiechtensteinLithuaniaLuxembourgMacao SAR, ChinaMacedonia, FYRMadagascarMalawiMalaysiaMaldivesMaliMaltaMarshall IslandsMauritaniaMauritiusMexicoMicronesia, Fed. Sts.MoldovaMonacoMongoliaMontenegroMoroccoMozambiqueMyanmarNamibiaNauruNepalNetherlandsNew CaledoniaNew ZealandNicaraguaNigerNigeriaNorwayOmanPakistanPalauPanamaPapua New GuineaParaguayPeruPhilippinesPolandPortugalPuerto RicoQatarRomaniaRussian FederationRwandaSamoaSan MarinoSao Tome and PrincipeSaudi ArabiaSenegalSerbiaSeychellesSierra LeoneSingaporeSlovak RepublicSloveniaSolomon IslandsSomaliaSouth AfricaSouth SudanSpainSri LankaSt. Kitts and NevisSt. LuciaSt. Vincent and the GrenadinesSudanSurinameSwazilandSwedenSwitzerlandSyrian Arab RepublicTajikistanTanzaniaThailandTimor-LesteTogoTongaTrinidad and TobagoTunisiaTurkeyTurkmenistanTuvaluUgandaUkraineUnited Arab EmiratesUnited KingdomUnited StatesUruguayUzbekistanVanuatuVenezuela, RBVietnamVirgin Islands (U.S.)West Bank and GazaYemen, Rep.ZambiaZimbabwe Timeline:
This timeline shows a graph from 1995 to 2016 of Bosnia and Herzegovina. No data until 1994. Number of actual observations by date: 22.
Source name:
World Development Indicators
Source organization:
World Bank national accounts data, and OECD National Accounts data files.
Categories, topics:
Economy & Growth
Last updated:
apr 23, 2017
Indicators value changes by year
Minimum:
442.632
jan 1, 1995
Maximum:
7.525K
jan 1, 2016
At the date of observation
Value
Absolute change
Change from previous value
jan 1, 1995
442.632
+442.632
0.0%
jan 1, 1996
600.157
+157.525
35.59%
jan 1, 1997
1.013K
+412.368
68.71%
jan 1, 1998
1.58K
+567.619
56.06%
jan 1, 1999
2.296K
+715.535
45.28%
jan 1, 2000
2.626K
+330.76
14.41%
jan 1, 2001
3.412K
+785.628
29.91%
jan 1, 2002
3.617K
+204.473
5.99%
jan 1, 2003
3.907K
+290.256
8.03%
jan 1, 2004
4.042K
+134.998
3.46%
jan 1, 2005
4.335K
+292.818
7.24%
jan 1, 2006
4.797K
+462.667
10.67%
jan 1, 2007
5.385K
+587.945
12.26%
jan 1, 2008
6.045K
+659.457
12.25%
jan 1, 2009
6.888K
+843.058
13.95%
jan 1, 2010
6.706K
-181.913
-2.64%
jan 1, 2011
6.716K
+10.553
0.16%
jan 1, 2012
6.894K
+177.676
2.65%
jan 1, 2013
6.895K
+0.965
0.01%
jan 1, 2014
7.086K
+190.747
2.77%
jan 1, 2015
7.205K
+119.605
1.69%
jan 1, 2016
7.525K
+319.905
4.44%
Ranking of countries by current statistics by years


Comments: