29
/
en
AIzaSyAYiBZKx7MnpbEhh9jyipgxe19OcubqV5w
April 1, 2024
195574
Mexico
MEX
true
2
1
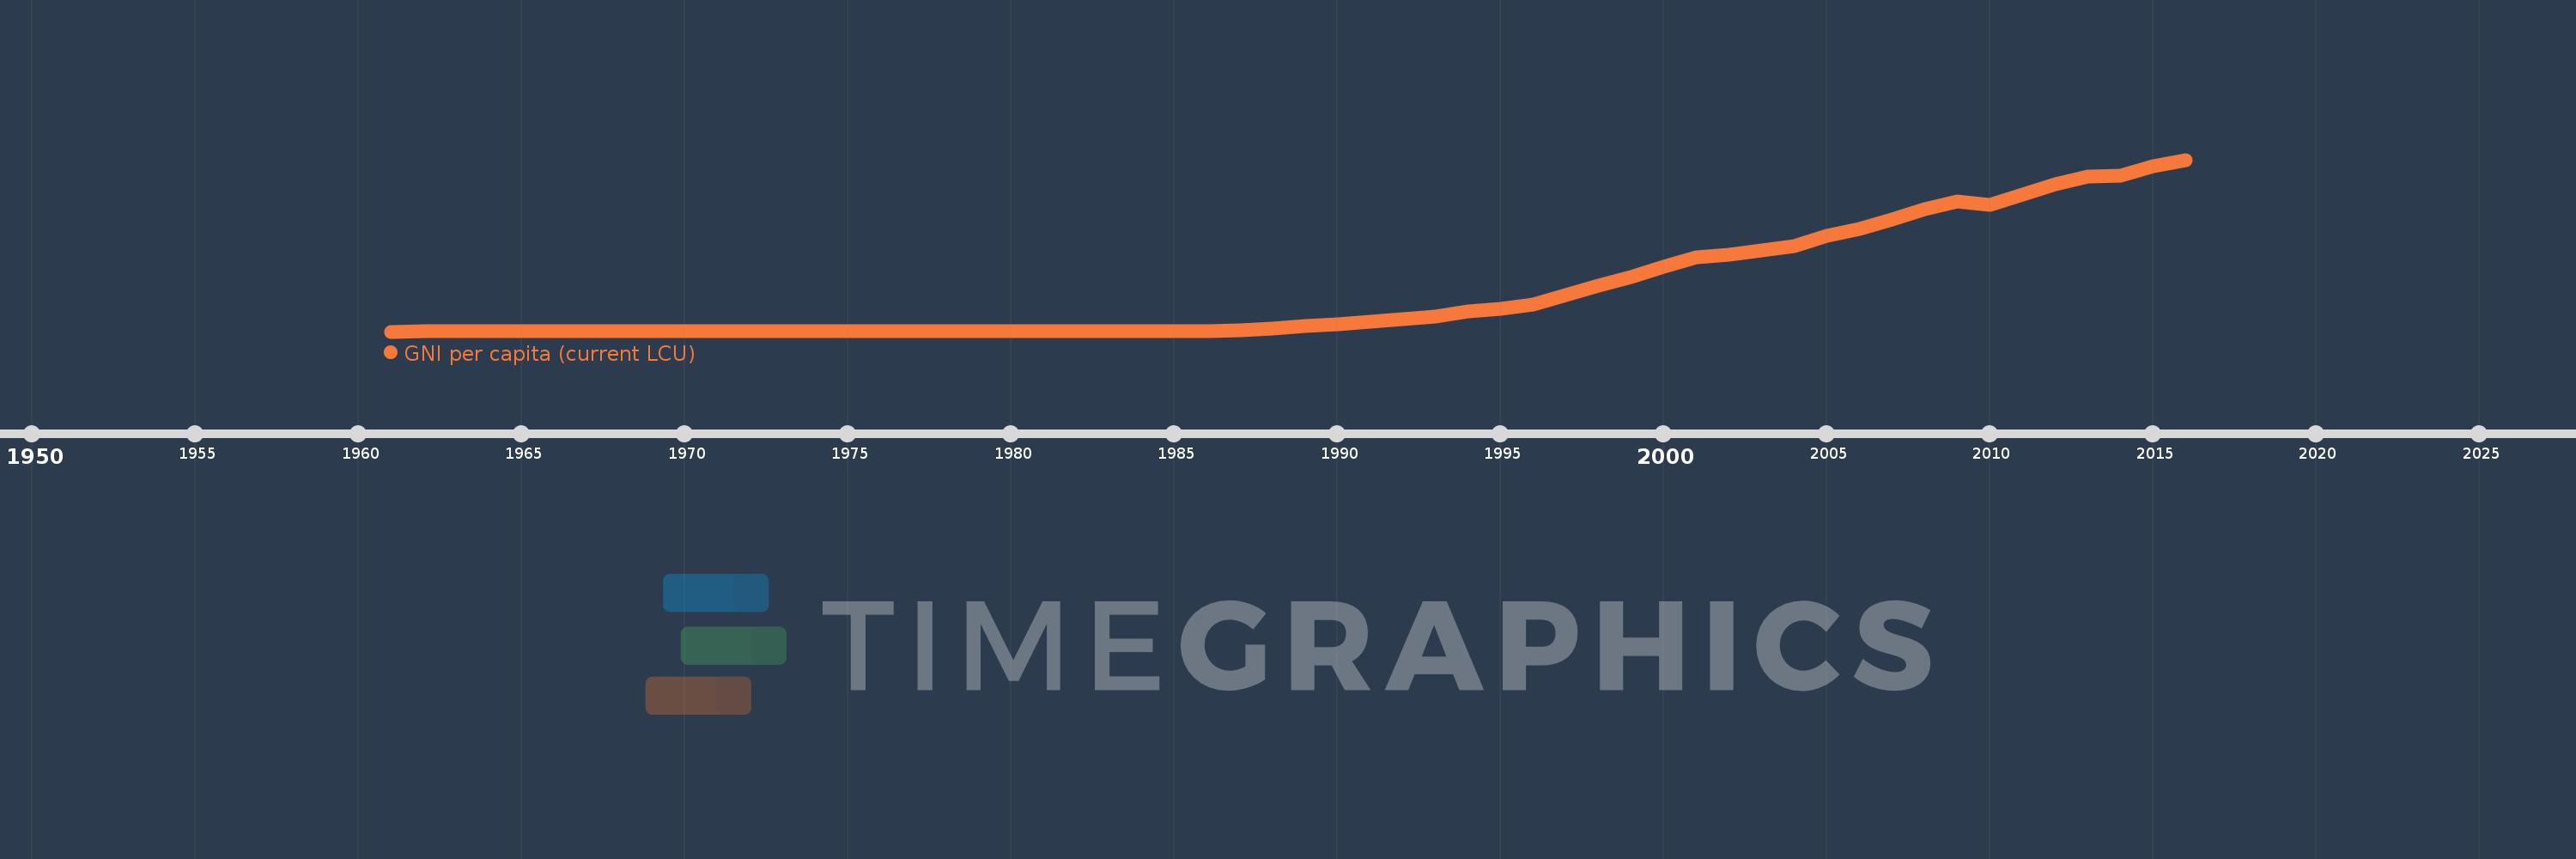
GNI per capita (current LCU)
2016,2015,2014,2013,2012,2011,2010,2009,2008,2007,2006,2005,2004,2003,2002,2001,2000,1999,1998,1997,1996,1995,1994,1993,1992,1991,1990,1989,1988,1987,1986,1985,1984,1983,1982,1981,1980,1979,1978,1977,1976,1975,1974,1973,1972,1971,1970,1969,1968,1967,1966,1965,1964,1963,1962,1961
This statistics in other country:
AfghanistanAlbaniaAlgeriaAmerican SamoaAndorraAngolaAntigua and BarbudaArgentinaArmeniaAustraliaAustriaAzerbaijanBahamas, TheBahrainBangladeshBarbadosBelarusBelgiumBelizeBeninBermudaBhutanBoliviaBosnia and HerzegovinaBotswanaBrazilBrunei DarussalamBulgariaBurkina FasoBurundiCabo VerdeCambodiaCameroonCanadaCentral African RepublicChadChannel IslandsChileChinaColombiaComorosCongo, Dem. Rep.Congo, Rep.Costa RicaCote d'IvoireCroatiaCubaCyprusCzech RepublicDenmarkDjiboutiDominicaDominican RepublicEcuadorEgypt, Arab Rep.El SalvadorEquatorial GuineaEritreaEstoniaEthiopiaFaroe IslandsFijiFinlandFranceFrench PolynesiaGabonGambia, TheGeorgiaGermanyGhanaGreeceGreenlandGrenadaGuamGuatemalaGuineaGuinea-BissauGuyanaHaitiHondurasHong Kong SAR, ChinaHungaryIcelandIndiaIndonesiaIran, Islamic Rep.IraqIrelandIsle of ManIsraelItalyJamaicaJapanJordanKazakhstanKenyaKiribatiKorea, Rep.KosovoKuwaitKyrgyz RepublicLao PDRLatviaLebanonLesothoLiberiaLibyaLiechtensteinLithuaniaLuxembourgMacao SAR, ChinaMacedonia, FYRMadagascarMalawiMalaysiaMaldivesMaliMaltaMarshall IslandsMauritaniaMauritiusMexicoMicronesia, Fed. Sts.MoldovaMonacoMongoliaMontenegroMoroccoMozambiqueMyanmarNamibiaNauruNepalNetherlandsNew CaledoniaNew ZealandNicaraguaNigerNigeriaNorwayOmanPakistanPalauPanamaPapua New GuineaParaguayPeruPhilippinesPolandPortugalPuerto RicoQatarRomaniaRussian FederationRwandaSamoaSan MarinoSao Tome and PrincipeSaudi ArabiaSenegalSerbiaSeychellesSierra LeoneSingaporeSlovak RepublicSloveniaSolomon IslandsSomaliaSouth AfricaSouth SudanSpainSri LankaSt. Kitts and NevisSt. LuciaSt. Vincent and the GrenadinesSudanSurinameSwazilandSwedenSwitzerlandSyrian Arab RepublicTajikistanTanzaniaThailandTimor-LesteTogoTongaTrinidad and TobagoTunisiaTurkeyTurkmenistanTuvaluUgandaUkraineUnited Arab EmiratesUnited KingdomUnited StatesUruguayUzbekistanVanuatuVenezuela, RBVietnamVirgin Islands (U.S.)West Bank and GazaYemen, Rep.ZambiaZimbabwe Timeline:
This timeline shows a graph from 1961 to 2016 of Mexico. No data until 1960. Number of actual observations by date: 56.
Source name:
World Development Indicators
Source organization:
World Bank national accounts data, and OECD National Accounts data files.
Categories, topics:
Economy & Growth
Last updated:
apr 23, 2017
Indicators value changes by year
Maximum:
141.66K
jan 1, 2016
At the date of observation
Value
Absolute change
Change from previous value
jan 1, 1961
4.153
+4.153
0.0%
jan 1, 1962
4.369
+0.216
5.21%
jan 1, 1963
4.562
+0.193
4.41%
jan 1, 1964
4.92
+0.358
7.84%
jan 1, 1965
5.625
+0.705
14.33%
jan 1, 1966
5.945
+0.321
5.7%
jan 1, 1967
6.407
+0.462
7.77%
jan 1, 1968
6.904
+0.497
7.76%
jan 1, 1969
7.4
+0.495
7.17%
jan 1, 1970
7.938
+0.539
7.28%
jan 1, 1971
8.389
+0.451
5.68%
jan 1, 1972
8.958
+0.568
6.78%
jan 1, 1973
9.996
+1.038
11.59%
jan 1, 1974
11.877
+1.881
18.82%
jan 1, 1975
14.96
+3.083
25.96%
jan 1, 1976
17.68
+2.719
18.18%
jan 1, 1977
21.339
+3.659
20.7%
jan 1, 1978
27.96
+6.622
31.03%
jan 1, 1979
34.39
+6.429
22.99%
jan 1, 1980
43.946
+9.556
27.79%
jan 1, 1981
62.341
+18.395
41.86%
jan 1, 1982
82.863
+20.523
32.92%
jan 1, 1983
125.521
+42.658
51.48%
jan 1, 1984
226.392
+100.871
80.36%
jan 1, 1985
366.875
+140.483
62.05%
jan 1, 1986
583.011
+216.135
58.91%
jan 1, 1987
944.915
+361.904
62.08%
jan 1, 1988
2.283K
+1.338K
141.6%
jan 1, 1989
4.863K
+2.58K
113.01%
jan 1, 1990
6.298K
+1.435K
29.52%
jan 1, 1991
8.348K
+2.05K
32.54%
jan 1, 1992
10.569K
+2.221K
26.61%
jan 1, 1993
12.295K
+1.726K
16.34%
jan 1, 1994
16.884K
+4.589K
37.32%
jan 1, 1995
18.733K
+1.849K
10.95%
jan 1, 1996
22.469K
+3.736K
19.94%
jan 1, 1997
30.298K
+7.829K
34.85%
jan 1, 1998
37.825K
+7.527K
24.84%
jan 1, 1999
44.816K
+6.992K
18.49%
jan 1, 2000
53.494K
+8.678K
19.36%
jan 1, 2001
61.496K
+8.001K
14.96%
jan 1, 2002
63.709K
+2.214K
3.6%
jan 1, 2003
66.661K
+2.951K
4.63%
jan 1, 2004
70.746K
+4.086K
6.13%
jan 1, 2005
79.203K
+8.457K
11.95%
jan 1, 2006
84.469K
+5.266K
6.65%
jan 1, 2007
92.408K
+7.939K
9.4%
jan 1, 2008
101.131K
+8.723K
9.44%
jan 1, 2009
107.238K
+6.107K
6.04%
jan 1, 2010
104.388K
-2.85K
-2.66%
jan 1, 2011
113.052K
+8.663K
8.3%
jan 1, 2012
121.164K
+8.113K
7.18%
jan 1, 2013
127.765K
+6.6K
5.45%
jan 1, 2014
128.361K
+596.205
0.47%
jan 1, 2015
136.535K
+8.174K
6.37%
jan 1, 2016
141.66K
+5.125K
3.75%
Ranking of countries by current statistics by years


Comments: