29
/
en
AIzaSyAYiBZKx7MnpbEhh9jyipgxe19OcubqV5w
April 1, 2024
166171
Kazakhstan
KAZ
true
2
1
GNI per capita (current LCU)
2016,2015,2014,2013,2012,2011,2010,2009,2008,2007,2006,2005,2004,2003,2002,2001,2000,1999,1998,1997,1996,1995,1994
This statistics in other country:
AfghanistanAlbaniaAlgeriaAmerican SamoaAndorraAngolaAntigua and BarbudaArgentinaArmeniaAustraliaAustriaAzerbaijanBahamas, TheBahrainBangladeshBarbadosBelarusBelgiumBelizeBeninBermudaBhutanBoliviaBosnia and HerzegovinaBotswanaBrazilBrunei DarussalamBulgariaBurkina FasoBurundiCabo VerdeCambodiaCameroonCanadaCentral African RepublicChadChannel IslandsChileChinaColombiaComorosCongo, Dem. Rep.Congo, Rep.Costa RicaCote d'IvoireCroatiaCubaCyprusCzech RepublicDenmarkDjiboutiDominicaDominican RepublicEcuadorEgypt, Arab Rep.El SalvadorEquatorial GuineaEritreaEstoniaEthiopiaFaroe IslandsFijiFinlandFranceFrench PolynesiaGabonGambia, TheGeorgiaGermanyGhanaGreeceGreenlandGrenadaGuamGuatemalaGuineaGuinea-BissauGuyanaHaitiHondurasHong Kong SAR, ChinaHungaryIcelandIndiaIndonesiaIran, Islamic Rep.IraqIrelandIsle of ManIsraelItalyJamaicaJapanJordanKazakhstanKenyaKiribatiKorea, Rep.KosovoKuwaitKyrgyz RepublicLao PDRLatviaLebanonLesothoLiberiaLibyaLiechtensteinLithuaniaLuxembourgMacao SAR, ChinaMacedonia, FYRMadagascarMalawiMalaysiaMaldivesMaliMaltaMarshall IslandsMauritaniaMauritiusMexicoMicronesia, Fed. Sts.MoldovaMonacoMongoliaMontenegroMoroccoMozambiqueMyanmarNamibiaNauruNepalNetherlandsNew CaledoniaNew ZealandNicaraguaNigerNigeriaNorwayOmanPakistanPalauPanamaPapua New GuineaParaguayPeruPhilippinesPolandPortugalPuerto RicoQatarRomaniaRussian FederationRwandaSamoaSan MarinoSao Tome and PrincipeSaudi ArabiaSenegalSerbiaSeychellesSierra LeoneSingaporeSlovak RepublicSloveniaSolomon IslandsSomaliaSouth AfricaSouth SudanSpainSri LankaSt. Kitts and NevisSt. LuciaSt. Vincent and the GrenadinesSudanSurinameSwazilandSwedenSwitzerlandSyrian Arab RepublicTajikistanTanzaniaThailandTimor-LesteTogoTongaTrinidad and TobagoTunisiaTurkeyTurkmenistanTuvaluUgandaUkraineUnited Arab EmiratesUnited KingdomUnited StatesUruguayUzbekistanVanuatuVenezuela, RBVietnamVirgin Islands (U.S.)West Bank and GazaYemen, Rep.ZambiaZimbabwe Timeline:
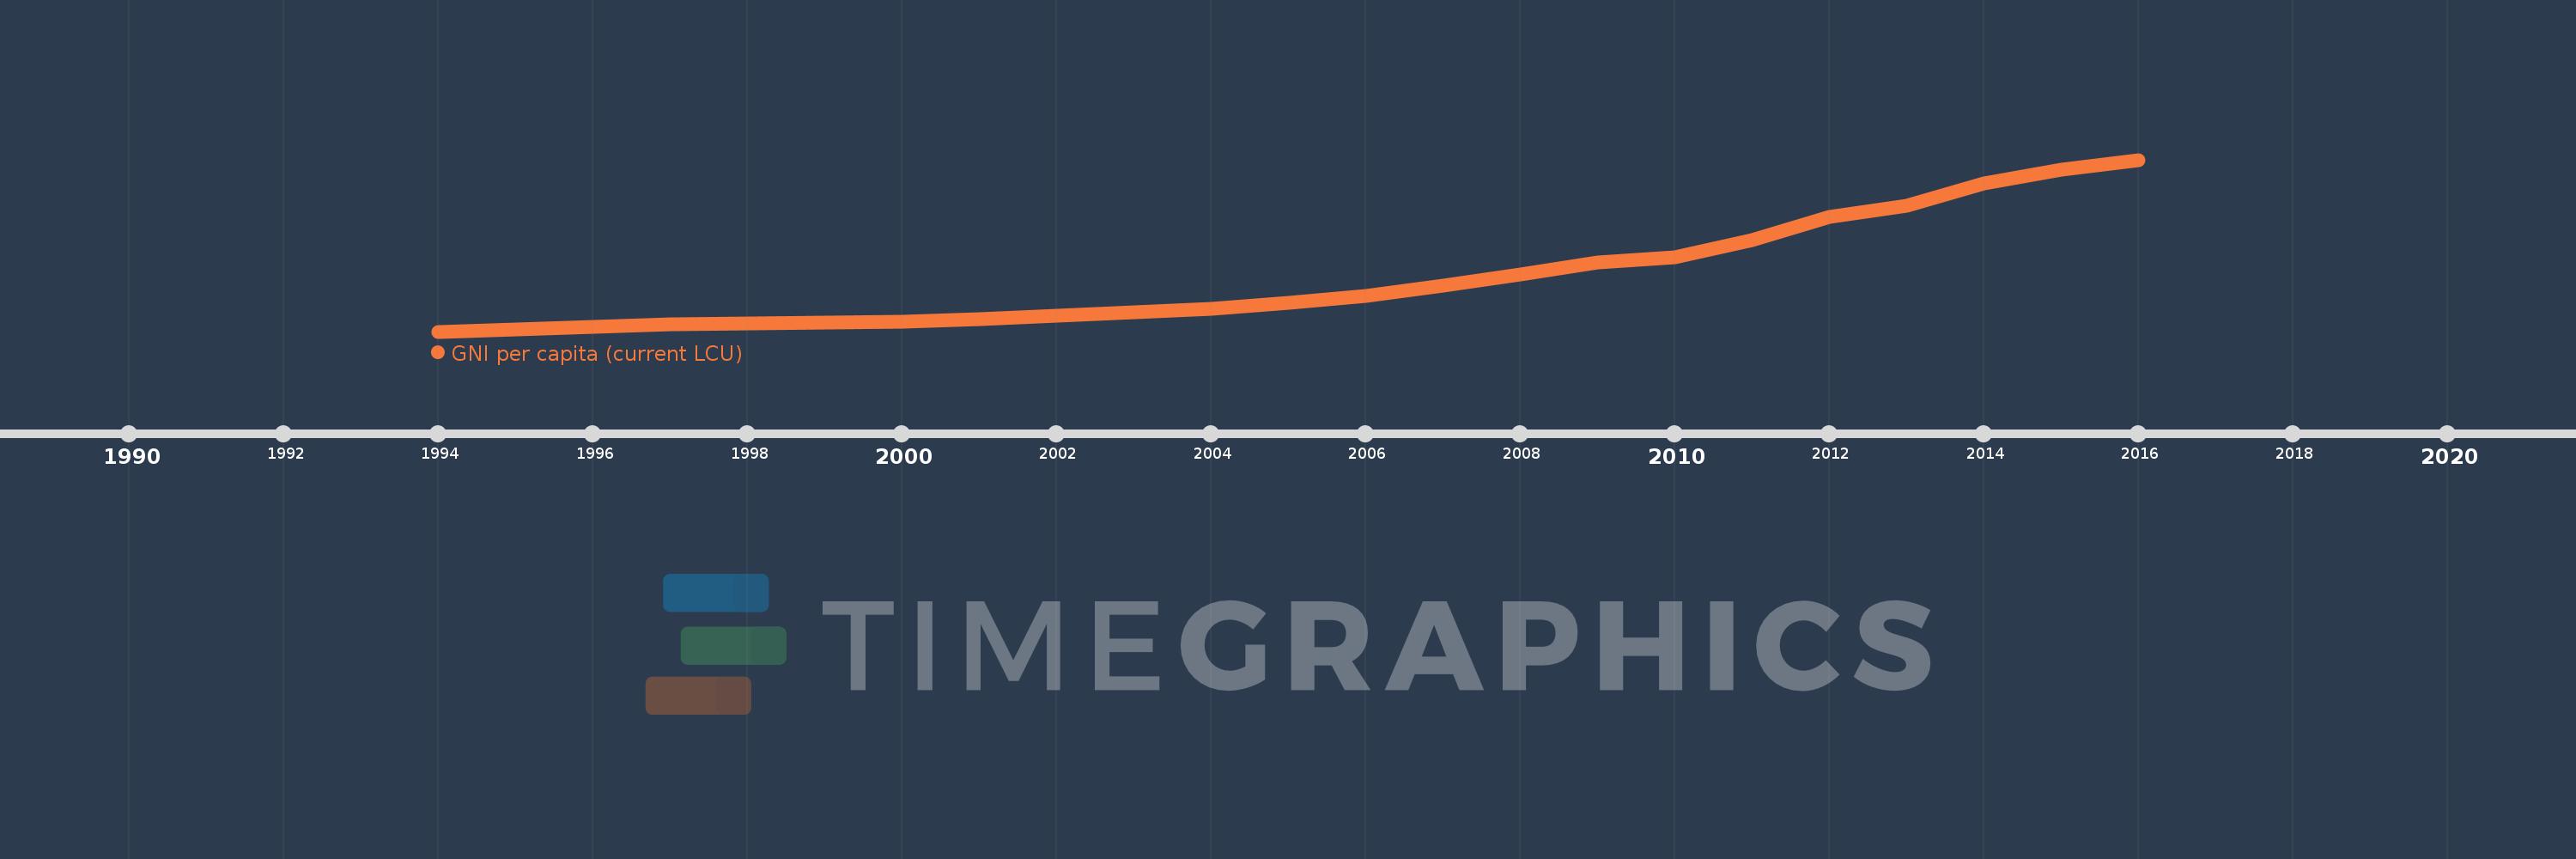
This timeline shows a graph from 1994 to 2016 of Kazakhstan. No data until 1993. Number of actual observations by date: 23.
Source name:
World Development Indicators
Source organization:
World Bank national accounts data, and OECD National Accounts data files.
Categories, topics:
Economy & Growth
Last updated:
apr 23, 2017
Indicators value changes by year
Minimum:
1.798K
jan 1, 1994
Maximum:
2.185 mln
jan 1, 2016
At the date of observation
Value
Absolute change
Change from previous value
jan 1, 1994
1.798K
+1.798K
0.0%
jan 1, 1995
26.191K
+24.392K
1.36K%
jan 1, 1996
63.668K
+37.477K
143.09%
jan 1, 1997
89.931K
+26.263K
41.25%
jan 1, 1998
107.501K
+17.57K
19.54%
jan 1, 1999
113.411K
+5.91K
5.5%
jan 1, 2000
130.521K
+17.11K
15.09%
jan 1, 2001
162.706K
+32.185K
24.66%
jan 1, 2002
206.557K
+43.85K
26.95%
jan 1, 2003
242.512K
+35.956K
17.41%
jan 1, 2004
291.819K
+49.307K
20.33%
jan 1, 2005
365.061K
+73.242K
25.1%
jan 1, 2006
454.05K
+88.989K
24.38%
jan 1, 2007
589.35K
+135.3K
29.8%
jan 1, 2008
727.316K
+137.966K
23.41%
jan 1, 2009
875.844K
+148.528K
20.42%
jan 1, 2010
941.182K
+65.338K
7.46%
jan 1, 2011
1.162 mln
+220.539K
23.43%
jan 1, 2012
1.46 mln
+298.613K
25.7%
jan 1, 2013
1.598 mln
+137.179K
9.39%
jan 1, 2014
1.889 mln
+291.107K
18.22%
jan 1, 2015
2.06 mln
+171.576K
9.08%
jan 1, 2016
2.185 mln
+124.631K
6.05%
Ranking of countries by current statistics by years


Comments: