29
/
en
AIzaSyAYiBZKx7MnpbEhh9jyipgxe19OcubqV5w
April 1, 2024
133168
Finland
FIN
true
2
1
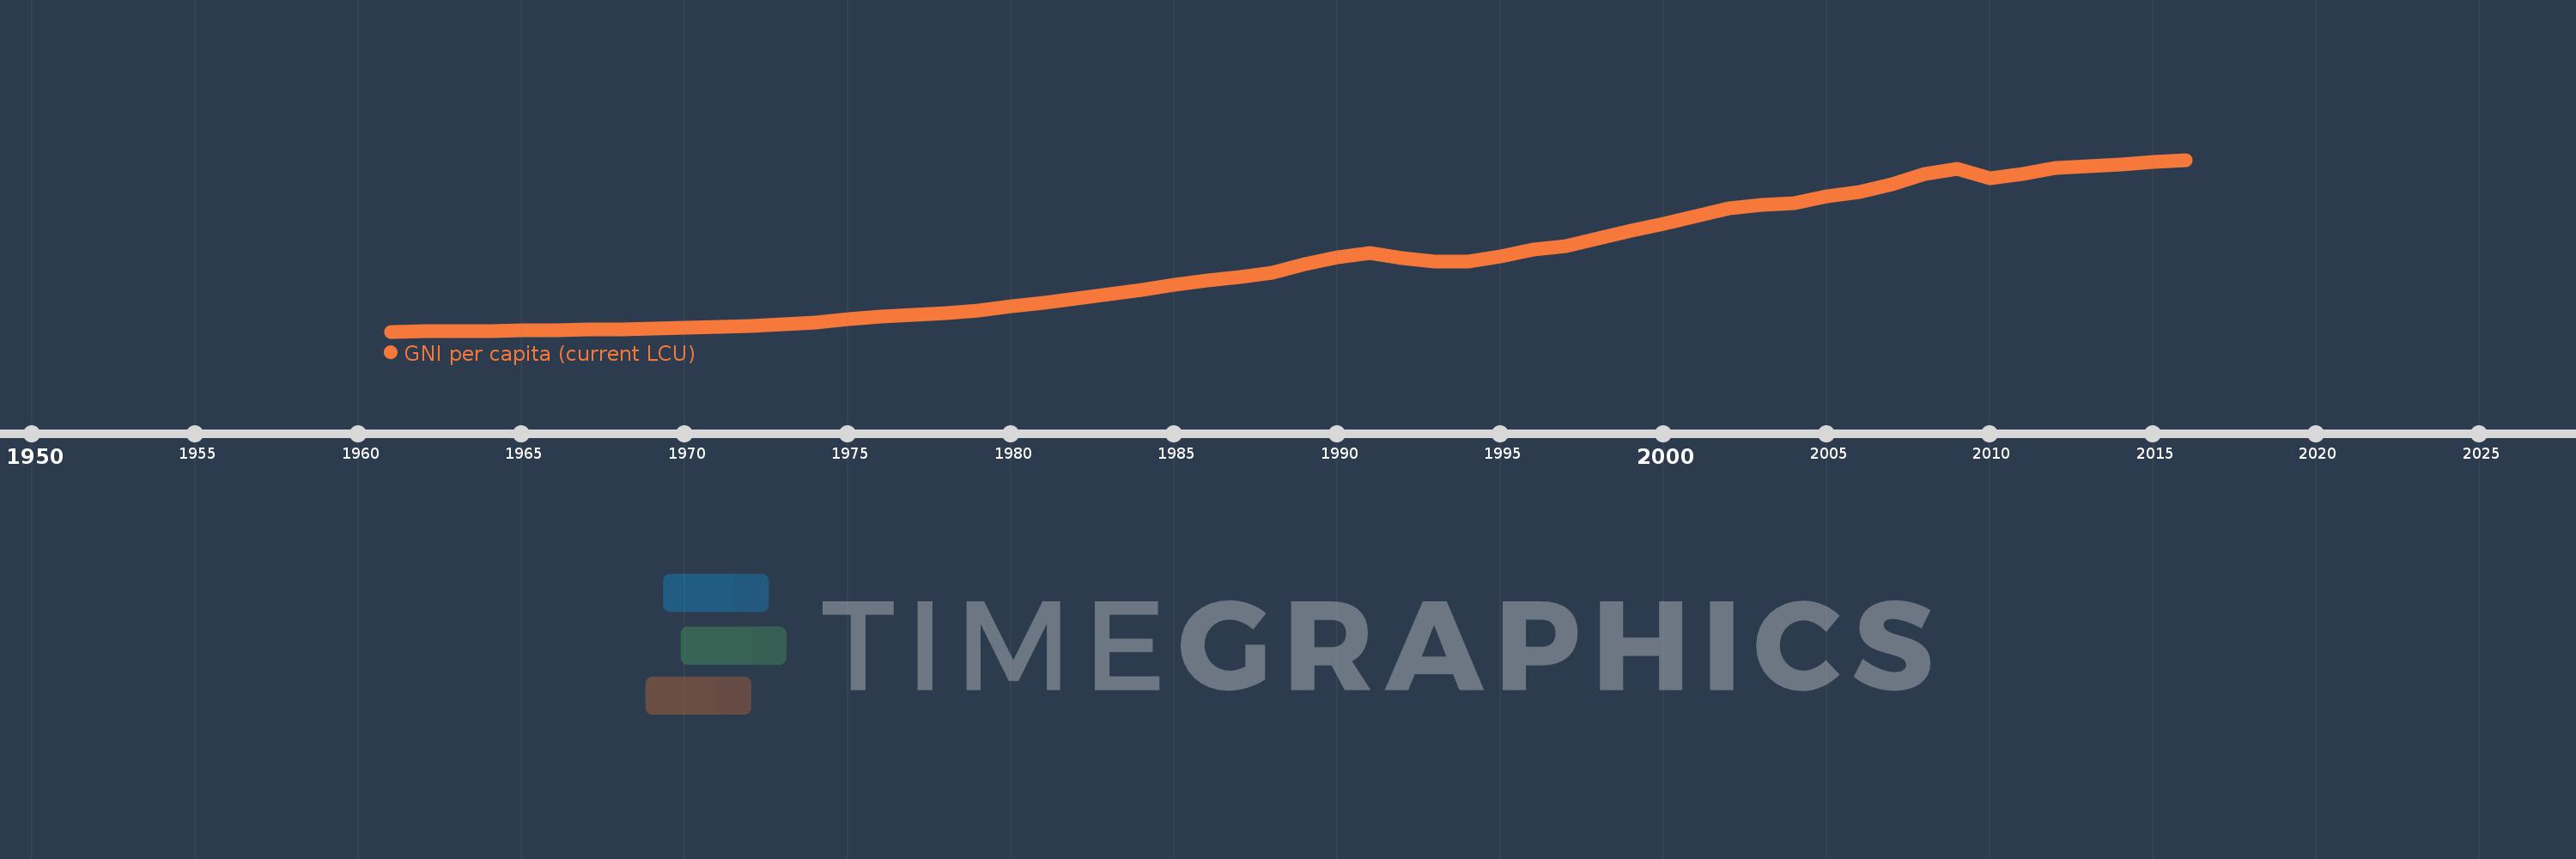
GNI per capita (current LCU)
2016,2015,2014,2013,2012,2011,2010,2009,2008,2007,2006,2005,2004,2003,2002,2001,2000,1999,1998,1997,1996,1995,1994,1993,1992,1991,1990,1989,1988,1987,1986,1985,1984,1983,1982,1981,1980,1979,1978,1977,1976,1975,1974,1973,1972,1971,1970,1969,1968,1967,1966,1965,1964,1963,1962,1961
This statistics in other country:
AfghanistanAlbaniaAlgeriaAmerican SamoaAndorraAngolaAntigua and BarbudaArgentinaArmeniaAustraliaAustriaAzerbaijanBahamas, TheBahrainBangladeshBarbadosBelarusBelgiumBelizeBeninBermudaBhutanBoliviaBosnia and HerzegovinaBotswanaBrazilBrunei DarussalamBulgariaBurkina FasoBurundiCabo VerdeCambodiaCameroonCanadaCentral African RepublicChadChannel IslandsChileChinaColombiaComorosCongo, Dem. Rep.Congo, Rep.Costa RicaCote d'IvoireCroatiaCubaCyprusCzech RepublicDenmarkDjiboutiDominicaDominican RepublicEcuadorEgypt, Arab Rep.El SalvadorEquatorial GuineaEritreaEstoniaEthiopiaFaroe IslandsFijiFinlandFranceFrench PolynesiaGabonGambia, TheGeorgiaGermanyGhanaGreeceGreenlandGrenadaGuamGuatemalaGuineaGuinea-BissauGuyanaHaitiHondurasHong Kong SAR, ChinaHungaryIcelandIndiaIndonesiaIran, Islamic Rep.IraqIrelandIsle of ManIsraelItalyJamaicaJapanJordanKazakhstanKenyaKiribatiKorea, Rep.KosovoKuwaitKyrgyz RepublicLao PDRLatviaLebanonLesothoLiberiaLibyaLiechtensteinLithuaniaLuxembourgMacao SAR, ChinaMacedonia, FYRMadagascarMalawiMalaysiaMaldivesMaliMaltaMarshall IslandsMauritaniaMauritiusMexicoMicronesia, Fed. Sts.MoldovaMonacoMongoliaMontenegroMoroccoMozambiqueMyanmarNamibiaNauruNepalNetherlandsNew CaledoniaNew ZealandNicaraguaNigerNigeriaNorwayOmanPakistanPalauPanamaPapua New GuineaParaguayPeruPhilippinesPolandPortugalPuerto RicoQatarRomaniaRussian FederationRwandaSamoaSan MarinoSao Tome and PrincipeSaudi ArabiaSenegalSerbiaSeychellesSierra LeoneSingaporeSlovak RepublicSloveniaSolomon IslandsSomaliaSouth AfricaSouth SudanSpainSri LankaSt. Kitts and NevisSt. LuciaSt. Vincent and the GrenadinesSudanSurinameSwazilandSwedenSwitzerlandSyrian Arab RepublicTajikistanTanzaniaThailandTimor-LesteTogoTongaTrinidad and TobagoTunisiaTurkeyTurkmenistanTuvaluUgandaUkraineUnited Arab EmiratesUnited KingdomUnited StatesUruguayUzbekistanVanuatuVenezuela, RBVietnamVirgin Islands (U.S.)West Bank and GazaYemen, Rep.ZambiaZimbabwe Timeline:
This timeline shows a graph from 1961 to 2016 of Finland. No data until 1960. Number of actual observations by date: 56.
Source name:
World Development Indicators
Source organization:
World Bank national accounts data, and OECD National Accounts data files.
Categories, topics:
Economy & Growth
Last updated:
apr 23, 2017
Indicators value changes by year
Minimum:
634.545
jan 1, 1961
Maximum:
38.476K
jan 1, 2016
At the date of observation
Value
Absolute change
Change from previous value
jan 1, 1961
634.545
+634.545
0.0%
jan 1, 1962
713.771
+79.227
12.49%
jan 1, 1963
758.351
+44.579
6.25%
jan 1, 1964
816.908
+58.558
7.72%
jan 1, 1965
915.547
+98.639
12.07%
jan 1, 1966
1.009K
+93.04
10.16%
jan 1, 1967
1.077K
+68.239
6.77%
jan 1, 1968
1.173K
+96.226
8.94%
jan 1, 1969
1.337K
+164.401
14.01%
jan 1, 1970
1.527K
+189.326
14.16%
jan 1, 1971
1.759K
+232.048
15.2%
jan 1, 1972
1.929K
+170.658
9.7%
jan 1, 1973
2.234K
+304.866
15.8%
jan 1, 1974
2.703K
+468.96
20.99%
jan 1, 1975
3.389K
+685.447
25.36%
jan 1, 1976
3.89K
+500.859
14.78%
jan 1, 1977
4.398K
+508.21
13.07%
jan 1, 1978
4.794K
+396.618
9.02%
jan 1, 1979
5.289K
+494.779
10.32%
jan 1, 1980
6.134K
+844.634
15.97%
jan 1, 1981
7.064K
+930.392
15.17%
jan 1, 1982
7.909K
+844.941
11.96%
jan 1, 1983
8.825K
+915.779
11.58%
jan 1, 1984
9.769K
+944.043
10.7%
jan 1, 1985
10.884K
+1.115K
11.41%
jan 1, 1986
11.822K
+938.175
8.62%
jan 1, 1987
12.717K
+895.03
7.57%
jan 1, 1988
13.684K
+966.555
7.6%
jan 1, 1989
15.486K
+1.802K
13.17%
jan 1, 1990
17.078K
+1.592K
10.28%
jan 1, 1991
17.929K
+850.818
4.98%
jan 1, 1992
16.858K
-1.071K
-5.97%
jan 1, 1993
16.138K
-719.876
-4.27%
jan 1, 1994
16.127K
-10.591
-0.07%
jan 1, 1995
17.129K
+1.002K
6.21%
jan 1, 1996
18.731K
+1.602K
9.35%
jan 1, 1997
19.466K
+735.209
3.93%
jan 1, 1998
21.223K
+1.756K
9.02%
jan 1, 1999
22.909K
+1.686K
7.94%
jan 1, 2000
24.325K
+1.417K
6.18%
jan 1, 2001
26.16K
+1.835K
7.54%
jan 1, 2002
27.829K
+1.669K
6.38%
jan 1, 2003
28.599K
+769.455
2.76%
jan 1, 2004
28.903K
+304.031
1.06%
jan 1, 2005
30.525K
+1.623K
5.61%
jan 1, 2006
31.466K
+940.864
3.08%
jan 1, 2007
33.086K
+1.619K
5.15%
jan 1, 2008
35.391K
+2.305K
6.97%
jan 1, 2009
36.525K
+1.134K
3.2%
jan 1, 2010
34.342K
-2.183K
-5.98%
jan 1, 2011
35.358K
+1.015K
2.96%
jan 1, 2012
36.702K
+1.345K
3.8%
jan 1, 2013
37.096K
+393.758
1.07%
jan 1, 2014
37.513K
+417.462
1.13%
jan 1, 2015
37.944K
+430.732
1.15%
jan 1, 2016
38.476K
+531.941
1.4%
Ranking of countries by current statistics by years


Comments: