Download This statistics in other country:
Timeline:
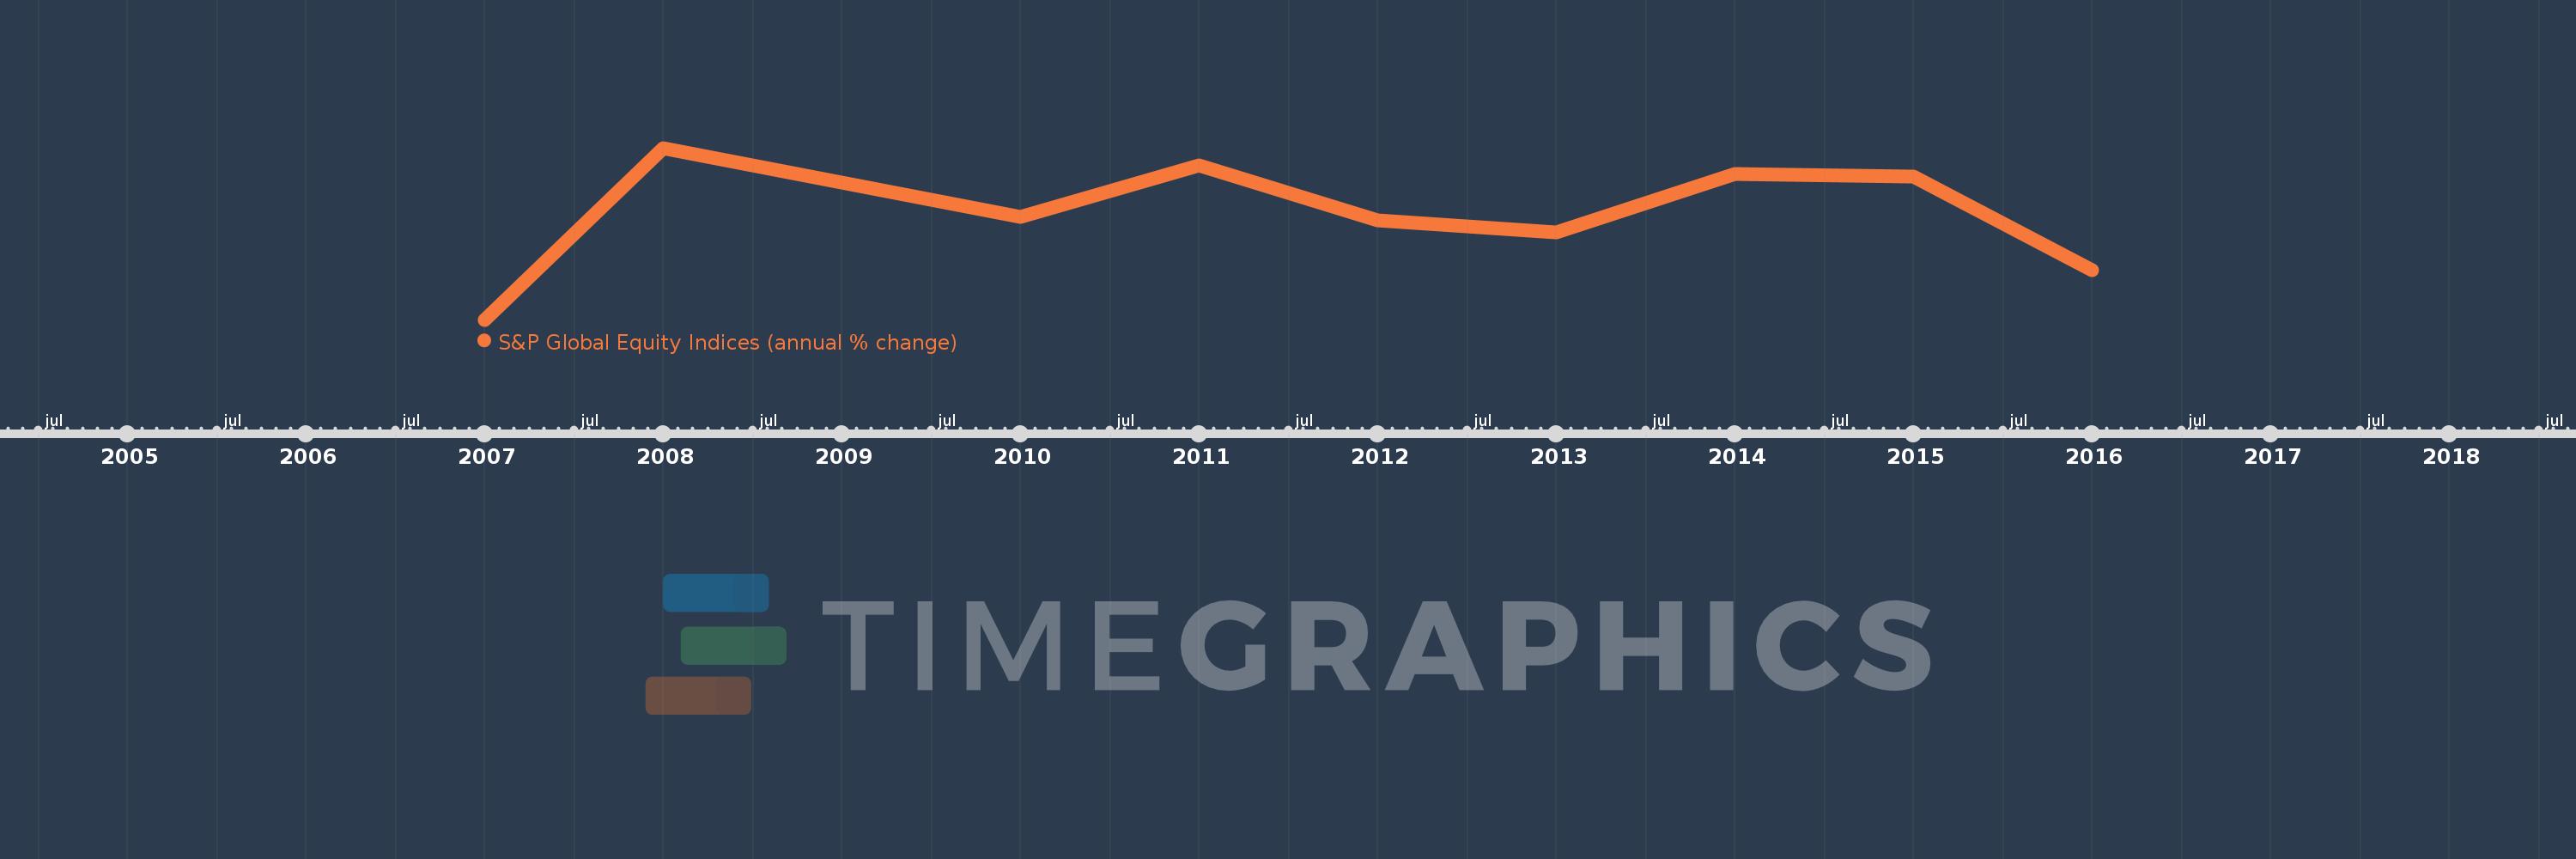
This timeline shows a graph from 2007 to 2016 of Qatar. No data until 2006. Number of actual observations by date: 9.
Source name:
World Development Indicators
Source organization:
Standard & Poor's, Global Stock Markets Factbook and supplemental S&P data.
Categories, topics:
Financial Sector
Last updated:
apr 23, 2017
Indicators value changes by year
Minimum:
-40.335
jan 1, 2007
Maximum:
35.443
jan 1, 2008
At the date of observation
Value
Absolute change
Change from the previous value
jan 1, 2007
-40.335
-40.335
0.0%
jan 1, 2008
35.443
+75.778
-187.87%
jan 1, 2010
5.058
-30.386
-85.73%
jan 1, 2011
27.744
+22.687
448.56%
jan 1, 2012
3.342
-24.403
-87.95%
jan 1, 2013
-1.863
-5.205
-155.74%
jan 1, 2014
23.974
+25.837
-1.39K%
jan 1, 2015
22.996
-0.979
-4.08%
jan 1, 2016
-18.645
-41.641
-181.08%
Ranking of countries by current statistics by years
