29
/
en
AIzaSyAYiBZKx7MnpbEhh9jyipgxe19OcubqV5w
April 1, 2024
155302
India
IND
true
2
1
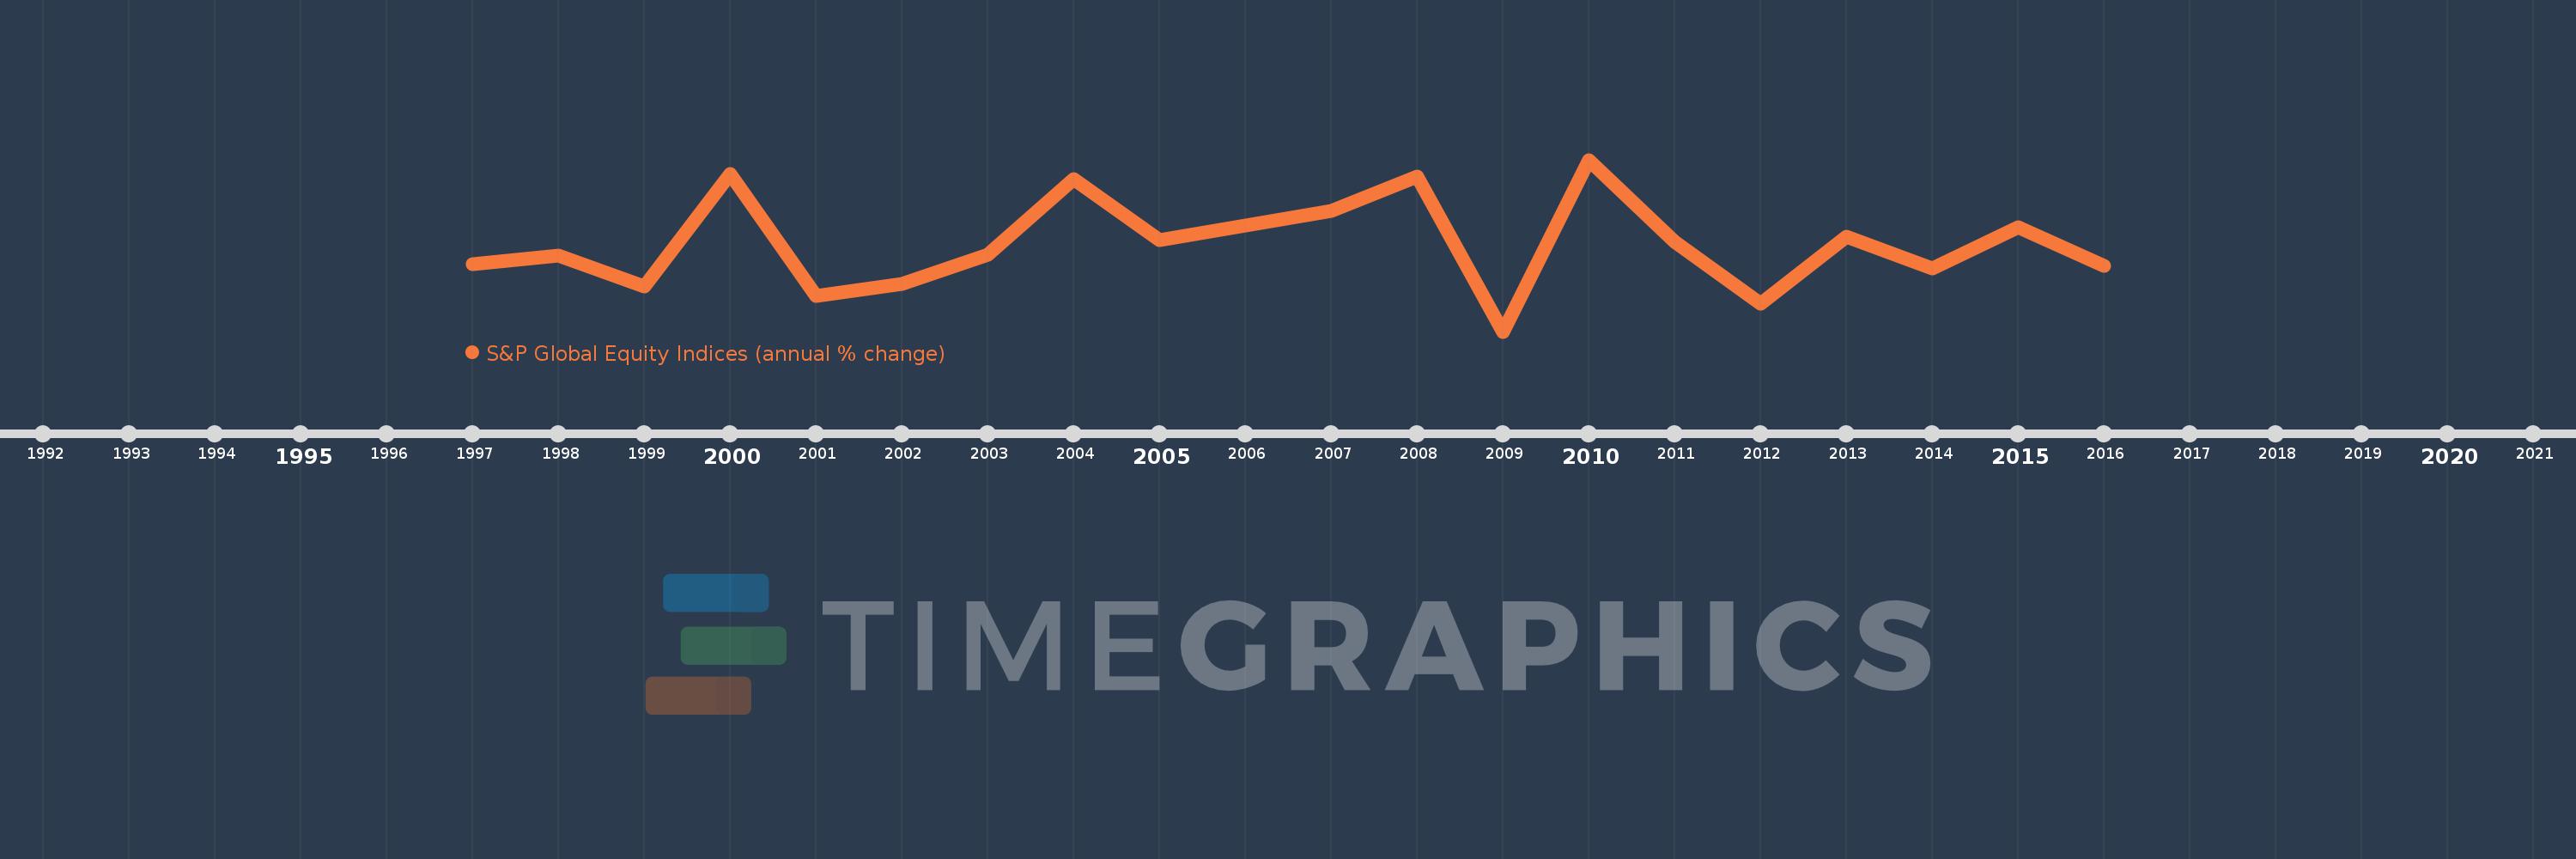
S&P Global Equity Indices (annual % change)
2016,2015,2014,2013,2012,2011,2010,2009,2008,2007,2006,2005,2004,2003,2002,2001,2000,1999,1998,1997
This statistics in other country:
Timeline:
This timeline shows a graph from 1997 to 2016 of India. No data until 1996. Number of actual observations by date: 20.
Source name:
World Development Indicators
Source organization:
Standard & Poor's, Global Stock Markets Factbook and supplemental S&P data.
Categories, topics:
Financial Sector
Last updated:
apr 23, 2017
Indicators value changes by year
Minimum:
-64.137
jan 1, 2009
At the date of observation
Value
Absolute change
Change from previous value
jan 1, 1997
-2.0
-2.0
0.0%
jan 1, 1998
5.801
+7.801
-390.05%
jan 1, 1999
-22.975
-28.776
-496.06%
jan 1, 2000
81.0
+103.975
-452.55%
jan 1, 2001
-31.082
-112.082
-138.37%
jan 1, 2002
-19.915
+11.167
-35.93%
jan 1, 2003
6.83
+26.745
-134.3%
jan 1, 2004
76.52
+69.69
1.02K%
jan 1, 2005
20.09
-56.43
-73.75%
jan 1, 2006
33.563
+13.473
67.06%
jan 1, 2007
46.701
+13.138
39.15%
jan 1, 2008
78.58
+31.879
68.26%
jan 1, 2009
-64.137
-142.717
-181.62%
jan 1, 2010
94.14
+158.277
-246.78%
jan 1, 2011
18.722
-75.418
-80.11%
jan 1, 2012
-38.049
-56.771
-303.22%
jan 1, 2013
23.331
+61.38
-161.32%
jan 1, 2014
-6.336
-29.667
-127.16%
jan 1, 2015
31.629
+37.965
-599.2%
jan 1, 2016
-3.91
-35.539
-112.36%
Ranking of countries by current statistics by years


Comments: