29
/
en
AIzaSyAYiBZKx7MnpbEhh9jyipgxe19OcubqV5w
April 1, 2024
124180
Ecuador
ECU
true
2
1
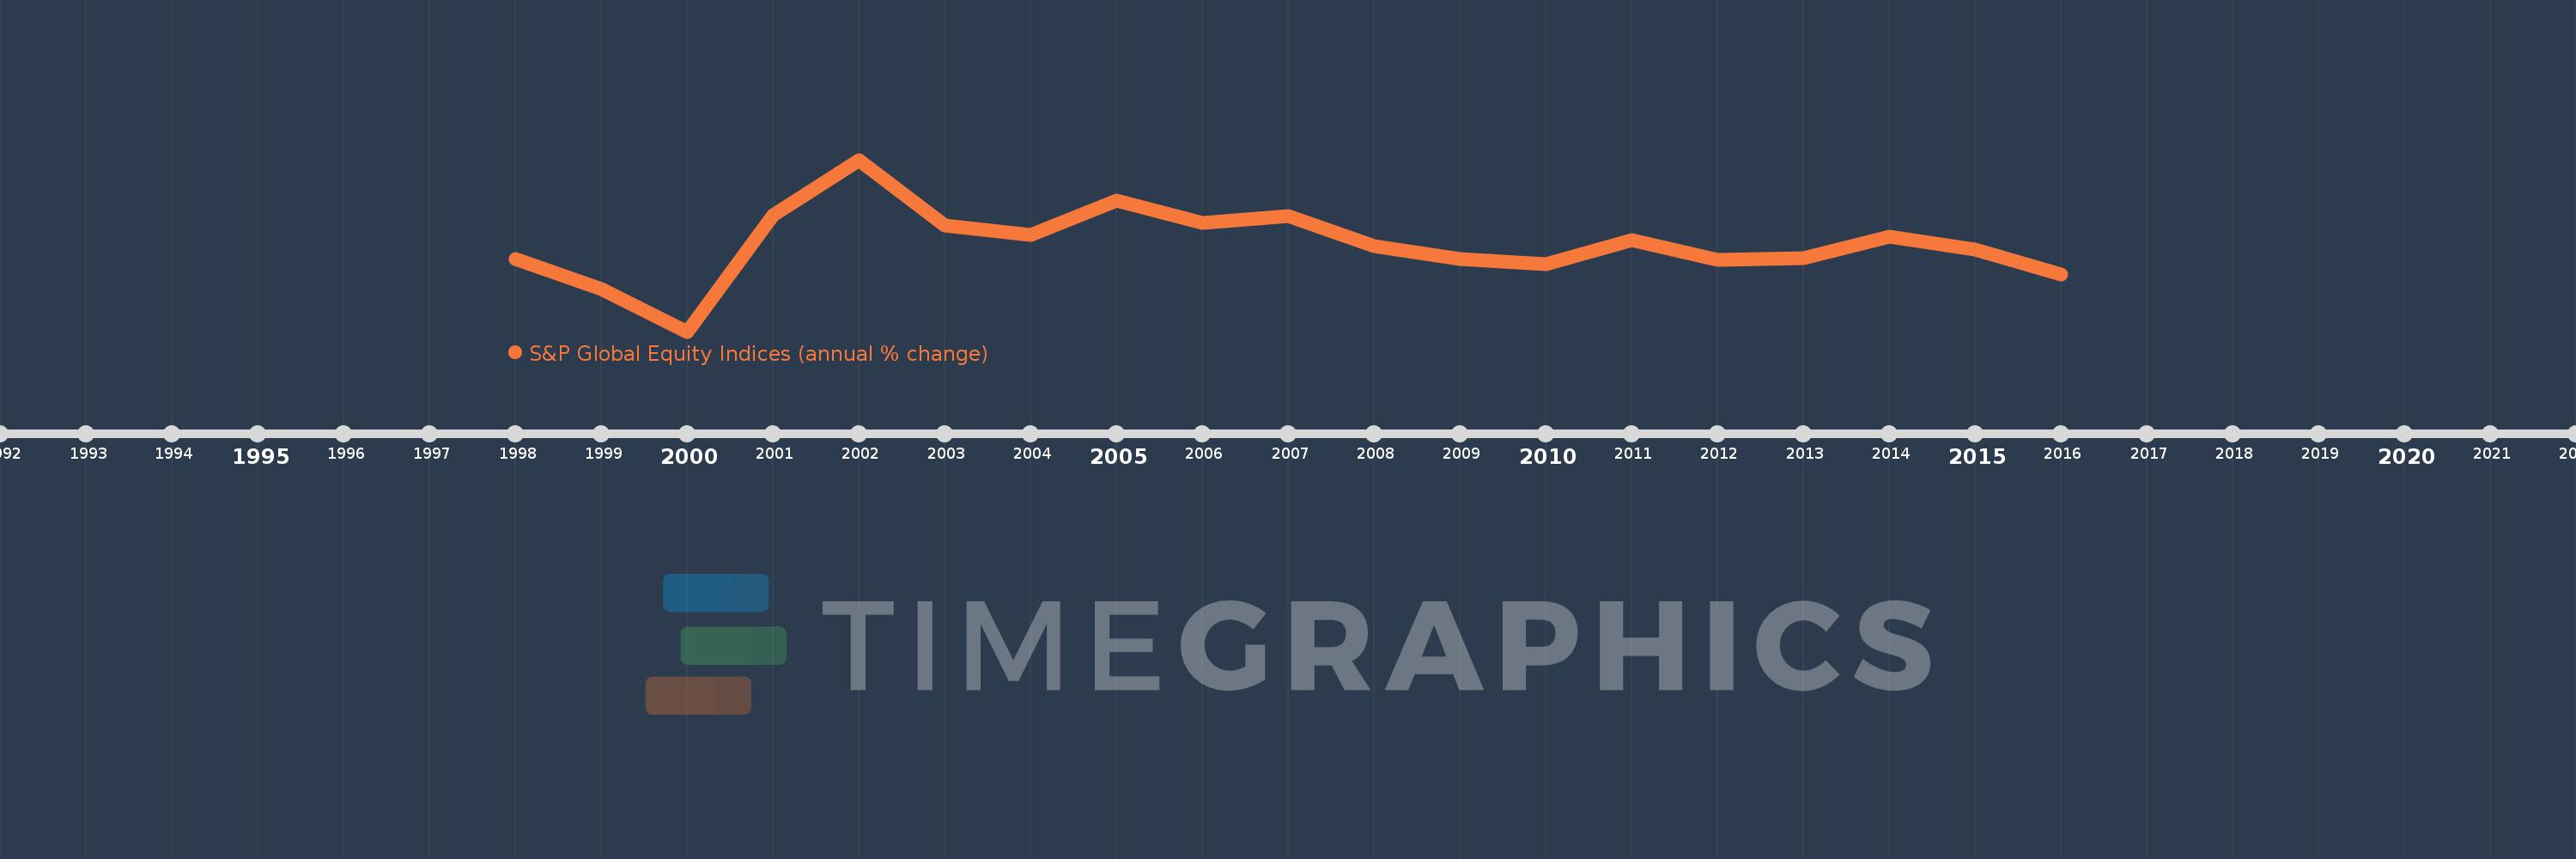
S&P Global Equity Indices (annual % change)
2016,2015,2014,2013,2012,2011,2010,2009,2008,2007,2006,2005,2004,2003,2002,2001,2000,1999,1998
This statistics in other country:
Timeline:
This timeline shows a graph from 1998 to 2016 of Ecuador. No data until 1997. Number of actual observations by date: 19.
Source name:
World Development Indicators
Source organization:
Standard & Poor's, Global Stock Markets Factbook and supplemental S&P data.
Categories, topics:
Financial Sector
Last updated:
apr 23, 2017
Indicators value changes by year
Maximum:
85.368
jan 1, 2002
At the date of observation
Value
Absolute change
Change from previous value
jan 1, 1998
-8.724
-8.724
0.0%
jan 1, 1999
-36.903
-28.178
322.98%
jan 1, 2000
-77.1
-40.197
108.93%
jan 1, 2001
33.004
+110.104
-142.81%
jan 1, 2002
85.368
+52.363
158.65%
jan 1, 2003
23.35
-62.017
-72.65%
jan 1, 2004
14.63
-8.72
-37.34%
jan 1, 2005
46.7
+32.07
219.21%
jan 1, 2006
25.999
-20.701
-44.33%
jan 1, 2007
31.966
+5.967
22.95%
jan 1, 2008
3.751
-28.215
-88.27%
jan 1, 2009
-8.805
-12.556
-334.73%
jan 1, 2010
-13.147
-4.343
49.32%
jan 1, 2011
9.695
+22.842
-173.74%
jan 1, 2012
-9.553
-19.248
-198.53%
jan 1, 2013
-7.444
+2.108
-22.07%
jan 1, 2014
12.272
+19.717
-264.85%
jan 1, 2015
0.727
-11.546
-94.08%
jan 1, 2016
-23.371
-24.098
-3.32K%
Ranking of countries by current statistics by years


Comments: