29
/
en
AIzaSyAYiBZKx7MnpbEhh9jyipgxe19OcubqV5w
April 1, 2024
287886
Zimbabwe
ZWE
true
2
1
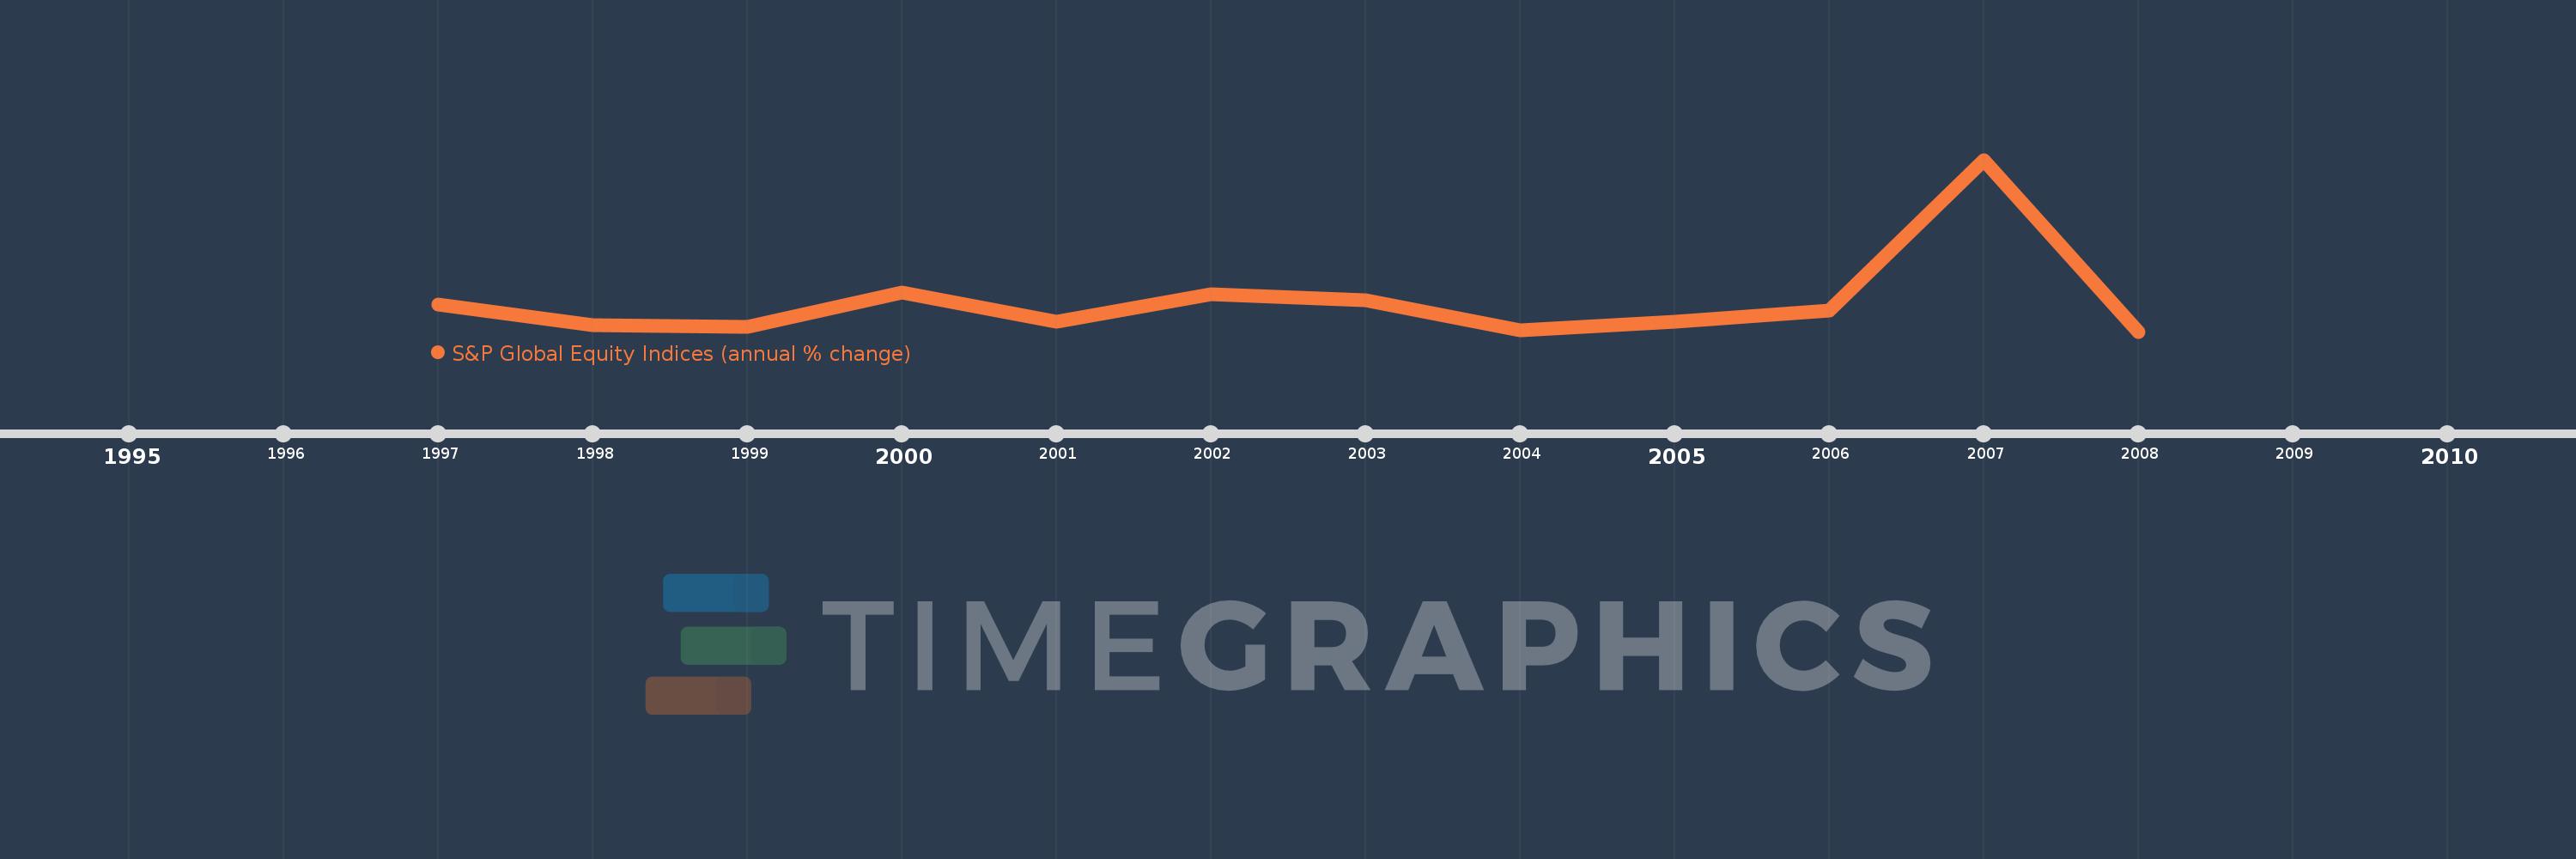
S&P Global Equity Indices (annual % change)
2008,2007,2006,2005,2004,2003,2002,2001,2000,1999,1998,1997
This statistics in other country:
Timeline:
This timeline shows a graph from 1997 to 2008 of Zimbabwe. No data until 1996. Number of actual observations by date: 12.
Source name:
World Development Indicators
Source organization:
Standard & Poor's, Global Stock Markets Factbook and supplemental S&P data.
Categories, topics:
Financial Sector
Last updated:
apr 23, 2017
Indicators value changes by year
Minimum:
-83.787
jan 1, 2008
Maximum:
912.281
jan 1, 2007
At the date of observation
Value
Absolute change
Change from previous value
jan 1, 1997
72.4
+72.4
0.0%
jan 1, 1998
-46.839
-119.239
-164.7%
jan 1, 1999
-58.147
-11.308
24.14%
jan 1, 2000
140.6
+198.747
-341.8%
jan 1, 2001
-24.572
-165.172
-117.48%
jan 1, 2002
134.277
+158.849
-646.46%
jan 1, 2003
97.94
-36.337
-27.06%
jan 1, 2004
-74.76
-172.7
-176.33%
jan 1, 2005
-26.7
+48.06
-64.29%
jan 1, 2006
36.582
+63.282
-237.01%
jan 1, 2007
912.281
+875.699
2.39K%
jan 1, 2008
-83.787
-996.068
-109.18%
Ranking of countries by current statistics by years


Comments: